IMAGE

Fig. 5.

ID
ZDB-IMAGE-231002-82
Source
Figures for Rogers et al., 2023
Image
Figure Caption

Fig. 5.

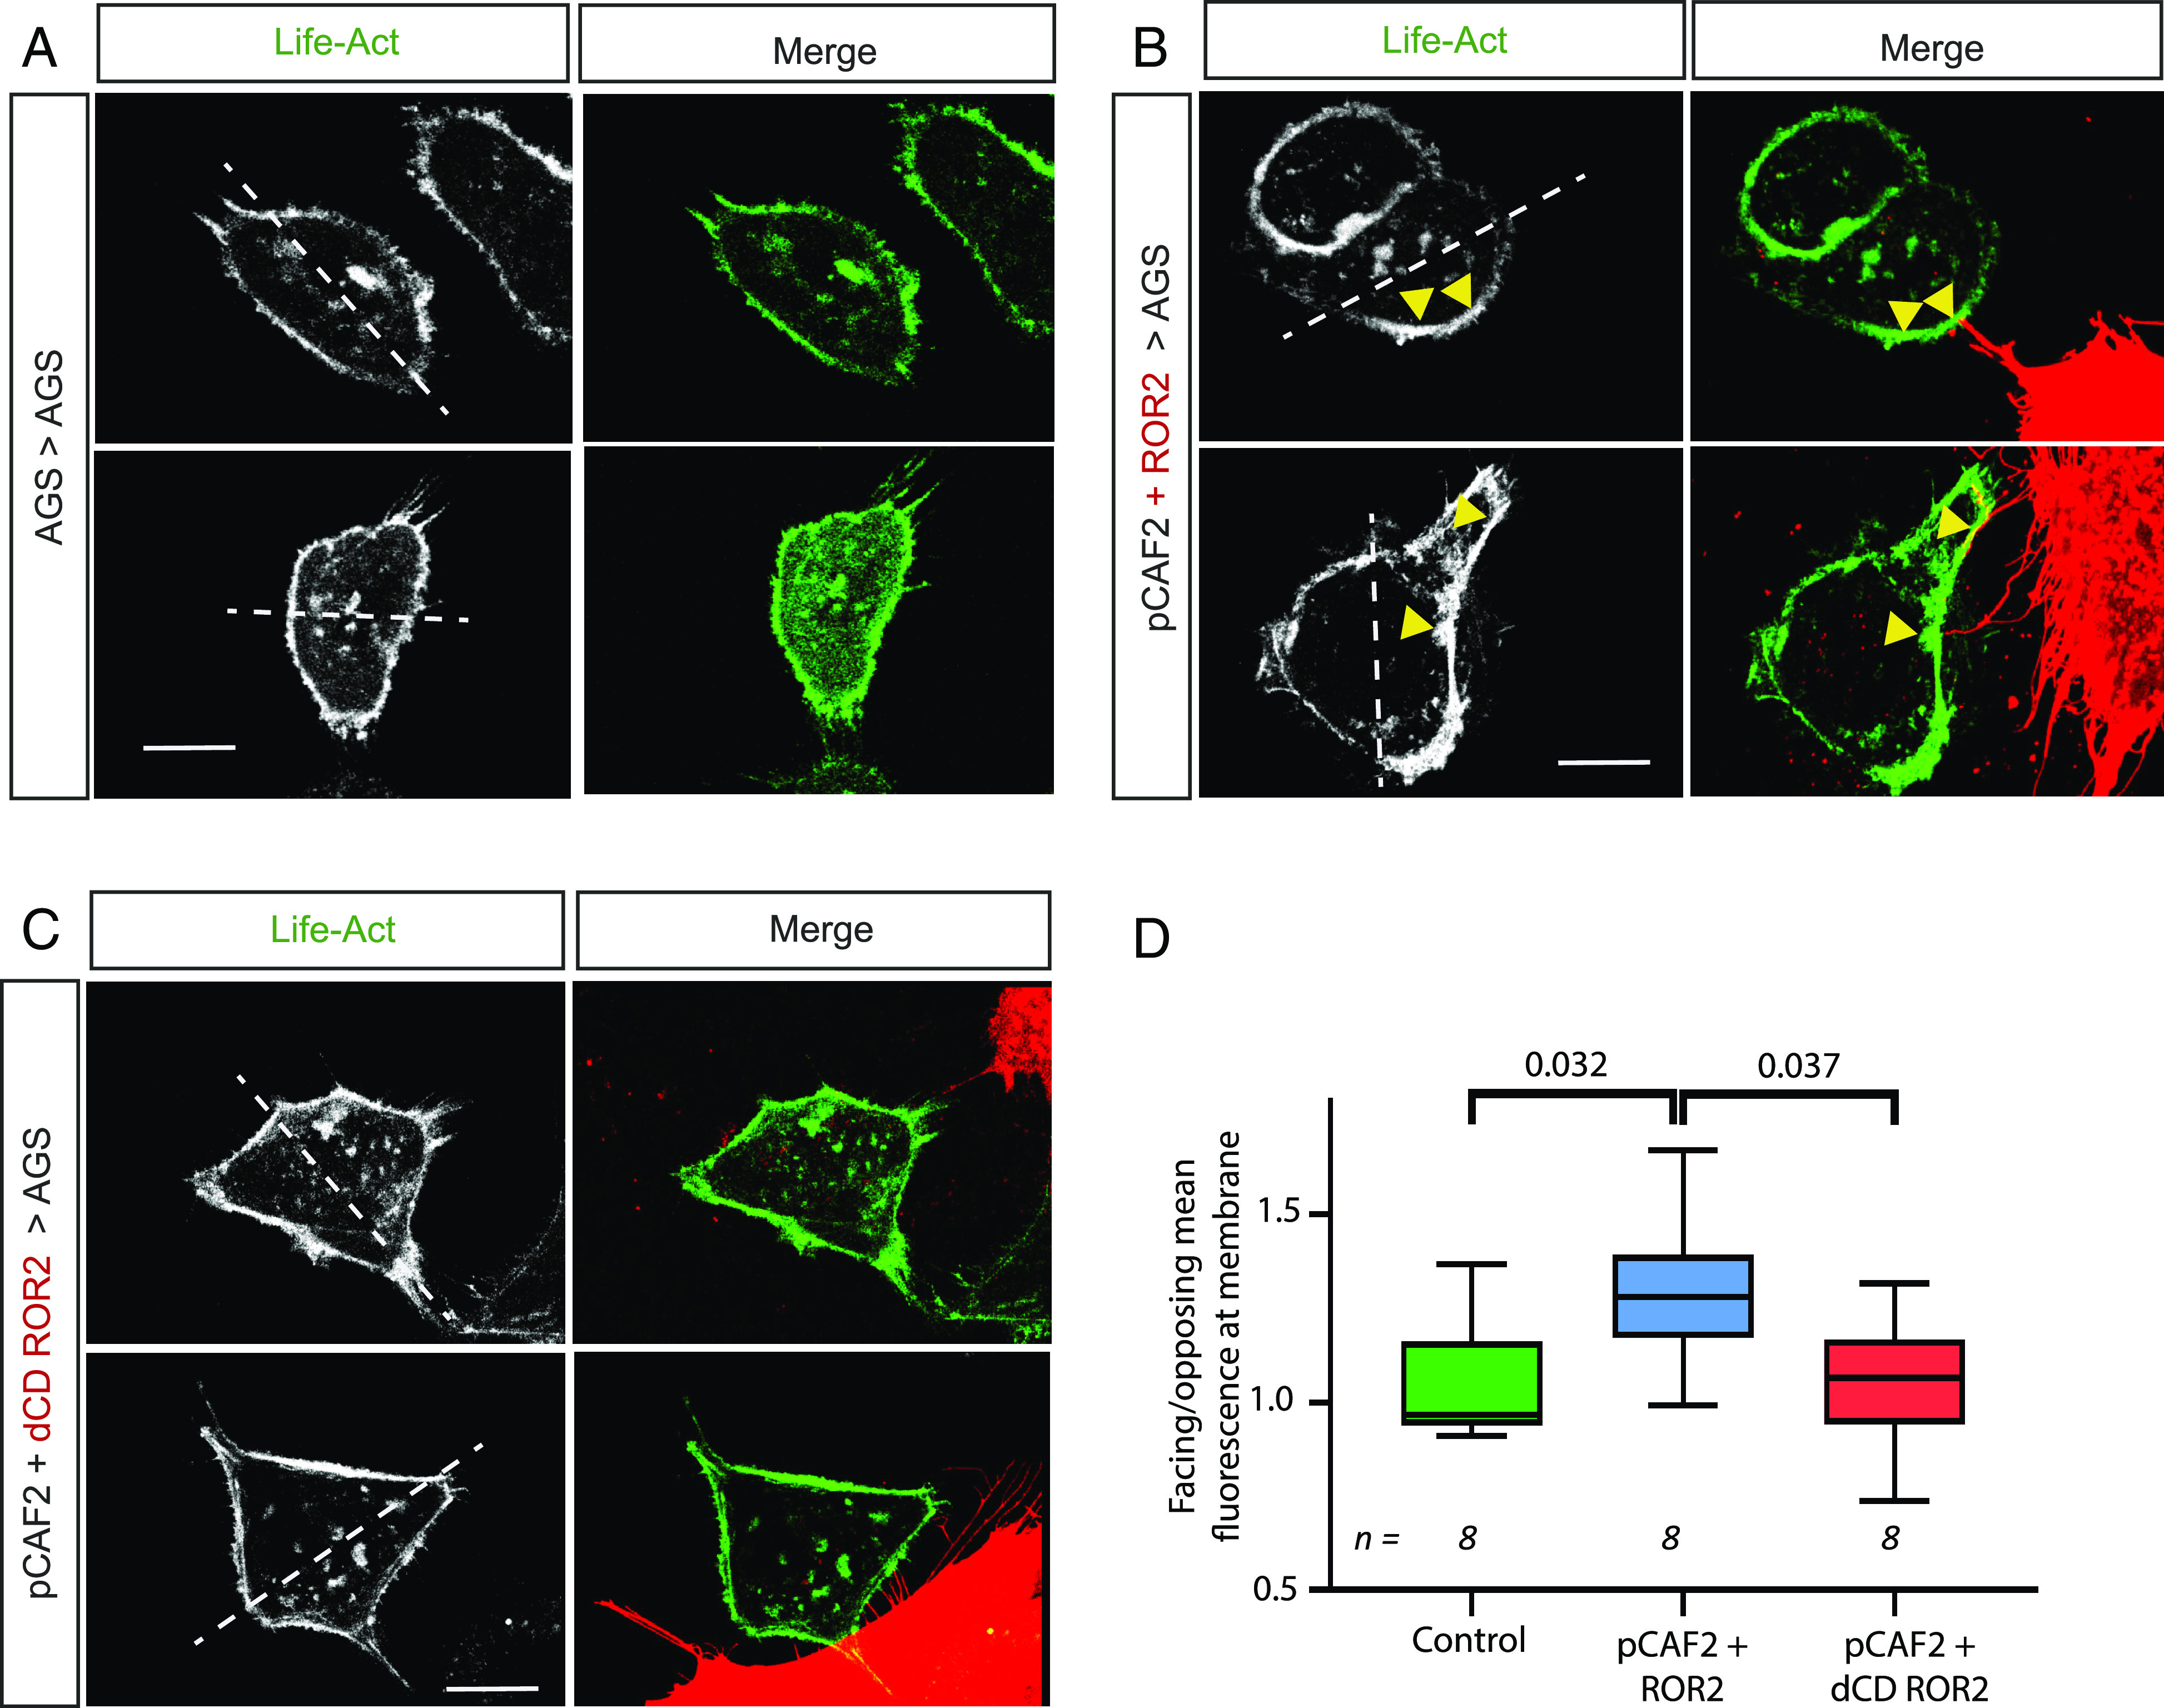
ROR2 induces actin polarization in receiving AGS cells. AGS cells were transfected with LifeAct GFP and cultured either (A) on their own (Control) or with pCAF2 cells overexpressing (B) ROR2 mCherry or (C) dCD ROR2 mCherry. Cells were imaged using confocal microscopy. The left-hand panel shows the 488-nm channel only (LifeAct-GFP), and the right-hand panel shows the merge of the green channel with the red channel to show the location of the producing cell and contact points. White dashed lines indicate a bisecting line through the center of the nucleus used to define the facing and opposing sides of the receiving cell. Yellow arrows indicate actin accumulation at contact points with ROR2-producing pCAF2 cells. The scale bar represents 10 μm. Two representative images from each condition are shown. (D) Quantification of facing/opposing mean fluorescent-labeled actin in receiving AGS cells in contact with cells as indicated on the X axis. n = number of receiving cells quantified. Significance was calculated using an unpaired t test between each two conditions.

Acknowledgments
This image is the copyrighted work of the attributed author or publisher, and ZFIN has permission only to display this image to its users. Additional permissions should be obtained from the applicable author or publisher of the image. Full text @ Proc. Natl. Acad. Sci. USA