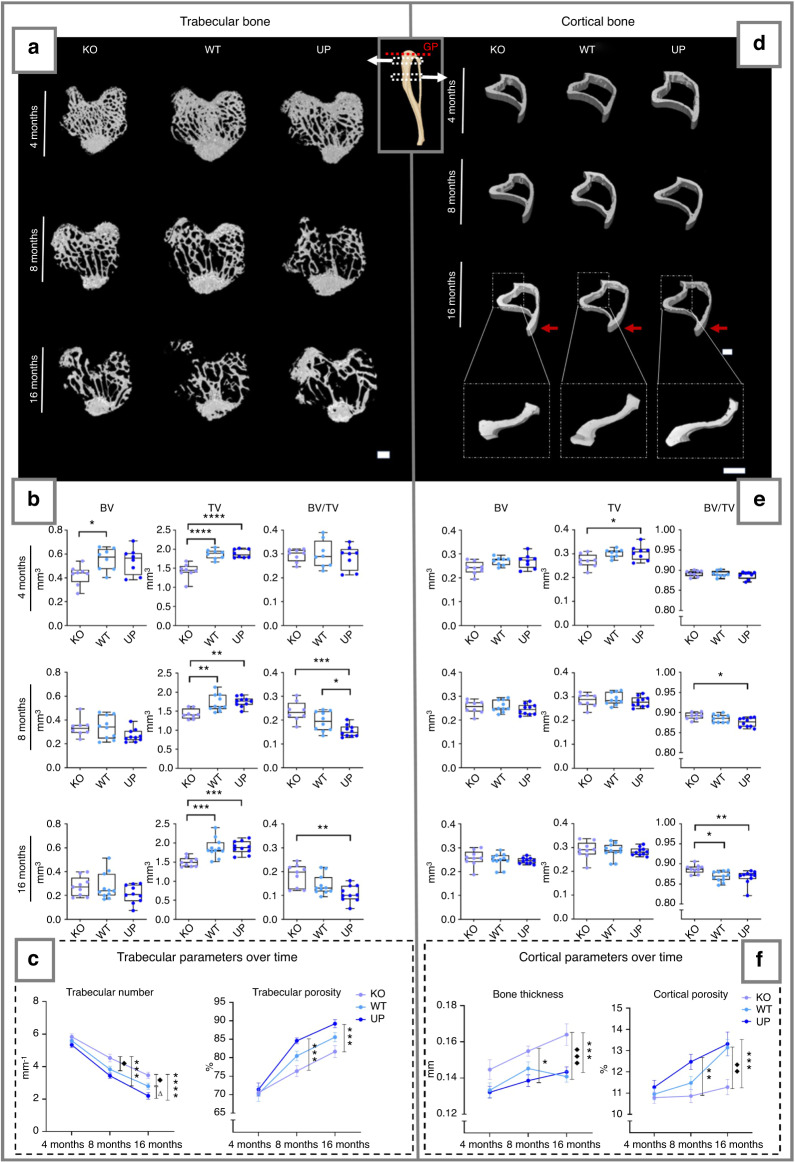
IMAGE

Fig. 3

ID
ZDB-IMAGE-231002-210
Source
Figures for Zappia et al., 2023
Image
Figure Caption

Fig. 3

µCT analysis of the metaphysis of the tibia of the male mice at 4, 8 and 16 months. The trabecular bone (left) and the cortical bone (right) were analyzed separately. Regions measured for the trabecular bone and cortical bone are illustrated on the schematic tibia with the growth plate (GP), marked with a red dotted line, used as a reference for their selection. a, d The 3D rendering of each genotype is represented with a scale bar of 500 µm. Red arrows indicate the tibial crest on the 16 months cortical bone. The zoom on the 16 months cortical bone illustrates the lateral side of the tibia with a scale bar of 500 µm. b, e The bone parameters measured for the trabecular and cortical bone were the bone volume (BV); the total volume (TV) and their ratio (BV/TV). The data were plotted as a box plot showing all points. One-way ANOVA was performed with differences being considered significant at P values <0.05 (*P < 0.05, **P ≤ 0.01, ***P ≤ 0.001, ****P ≤ 0.000 1). c, f The trabecular number, trabecular porosity, cortical thickness, and cortical porosity are represented over time. At 4 months: n = 8 for each genotype; at 8 months: n = 8 for the KO, n = 10 for the WT and UP; at 16 months: n = 9 for the KO, n = 11 for the WT, and n = 10 for the UP. Two-way ANOVA was performed on the analysis over time with error bars representing ± SEM and differences being considered significant at P values <0.05, * represents significant differences between the KO and the UP, ♦ represents significant differences between the KO and the WT and Δ represents significant differences between the WT and the UP (*/♦/ΔP < 0.05, **/♦♦/ΔΔP ≤ 0.01, ***/♦♦♦P ≤ 0.001)

Acknowledgments
This image is the copyrighted work of the attributed author or publisher, and ZFIN has permission only to display this image to its users. Additional permissions should be obtained from the applicable author or publisher of the image. Full text @ Bone Res