
|
FIGURE 4
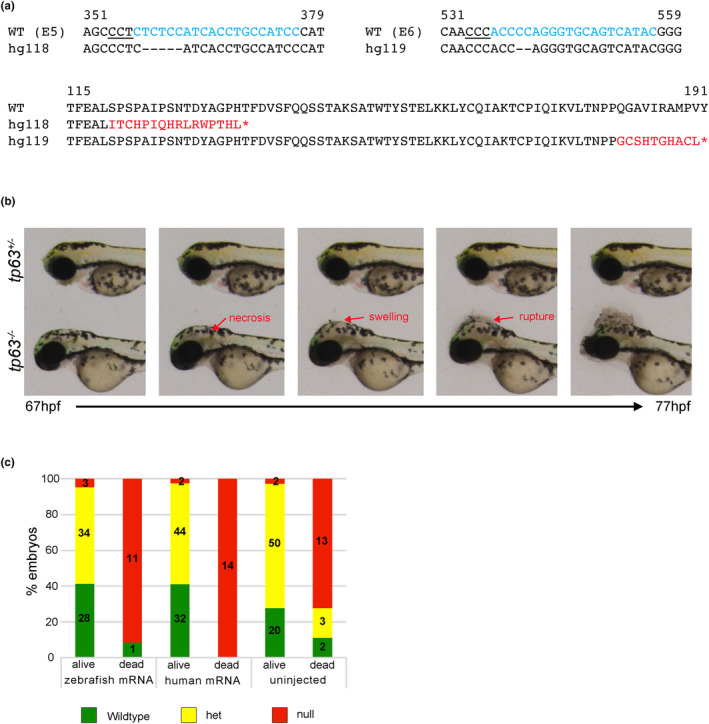
Generation and characterization of tp63 knockout mutants. (a) Top panel: Nucleotide sequences of CRISPR target regions in exons 5 and 6 with sgRNAs marked in cyan, PAM sites underlined, and deleted nucleotides in the mutant alleles marked by dashes. Bottom panel: An alignment of WT and mutant proteins with the frameshift and premature stop codons marked in red. (b) Phenotype of the tp63 −/− embryos shown as images at different time points from a time lapse video taken from 67 to 77 hpf. Images of a heterozygote sibling are shown for control. At 67 hpf the tp63 −/− embryo is indistinguishable from its heterozygous sibling. Shortly after necrosis within the head begins followed by swelling and rupture as marked by red arrows. (c) Data from rescue experiments by injections of 500 pg of zebrafish or human tp63 mRNA shown as bar graphs. Embryos were observed for phenotype between 72–78 hpf, separated into dead or alive groups and genotyped. Different groups of embryos that were scored are shown on the X‐axis and percentages of embryos of different genotypes are shown on the Y‐axis.