IMAGE

Figure 5

ID
ZDB-IMAGE-230731-113
Source
Figures for Cannone et al., 2023
Image
Figure Caption

Figure 5

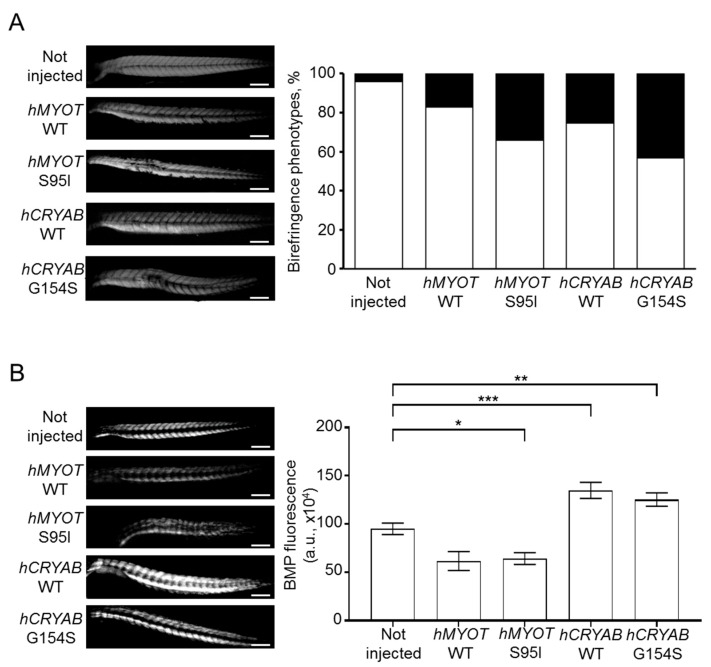
Effects on muscle fiber structure and development of both wildtype and mutant hMYOT and hCRYAB genes. (A). Birefringence analysis of zebrafish embryos at 48 hpf. Left panels in (A) show representative birefringence images of embryos for each analyzed condition. Scale bar is 200 μm. Total number of embryos analyzed for each condition: not injected wildtype embryos (n = 199), injected embryos with hMYOT WT (n = 35), hMYOT S95I (n = 41), hCRYAB WT (n = 87), hCRYAB G154S (n = 92). Right panel in (A) shows the bar graph reporting the percentage of birefringence phenotypes for each analyzed condition. By considering 100% as the total number of embryos analyzed for each condition, the white open bars represent the percentage of embryos with normal birefringence phenotype, while the closed black bars represent the percentage of severe birefringence phenotype. Three independent experiments have been performed. (B). The involvement of BMP signaling pathway in muscle structure development was evaluated by checking GFP fluorescence of Tg(BMPRE:EGFP)ia18 zebrafish embryos at 48hpf not injected (n = 127) or injected with hMYOT WT (n = 32), hMYOT S95I (n = 57), hCRYAB WT (n = 68), hCRYAB G154S (n = 98). Left panels in (B) show representative images of fluorescent embryos for each analyzed condition. Scale bar is 200 μM. Right panel in (B) shows the bar graph reporting the integrated density of fluorescent pixel area in the trunk region ± s.e.m.. Four independent experiments were performed. * p < 0.05, ** p < 0.01, *** p < 0.001 according to One-way ANOVA test with Bonferroni correction.

Acknowledgments
This image is the copyrighted work of the attributed author or publisher, and ZFIN has permission only to display this image to its users. Additional permissions should be obtained from the applicable author or publisher of the image. Full text @ Int. J. Mol. Sci.