
Image
|
Figure Caption
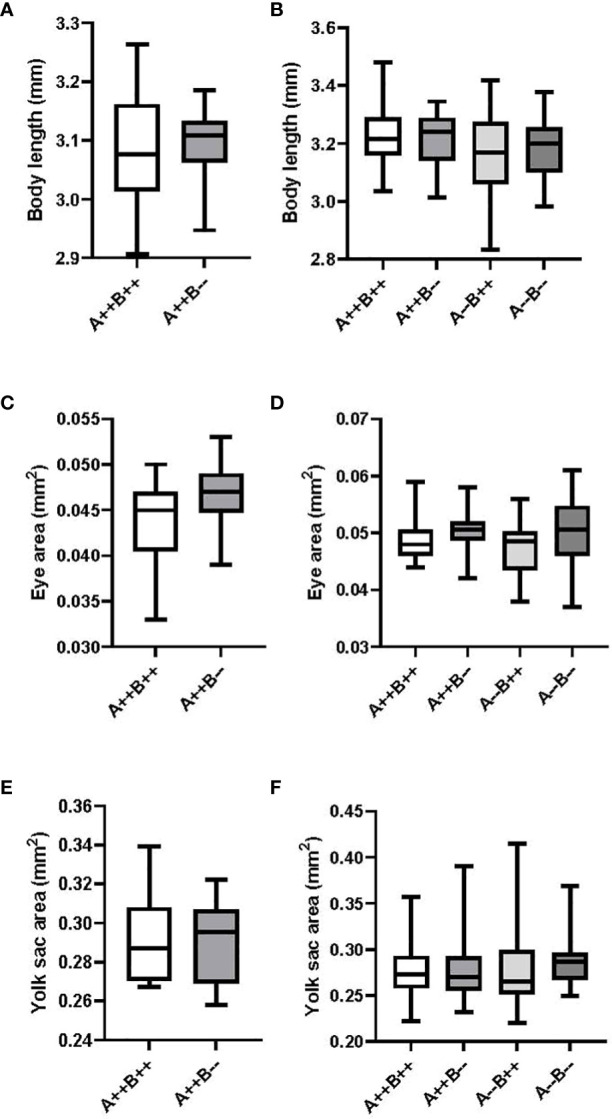
Figure 4
Body length, eye area, and yolk sac area measurements of eleutheroembryos from zebrafish pairwise mating trials on day 2 post-fertilization. Eleutheroembryos from test females (n=9-14) are displayed on the left
Acknowledgments
This image is the copyrighted work of the attributed author or publisher, and
ZFIN has permission only to display this image to its users.
Additional permissions should be obtained from the applicable author or publisher of the image.
Full text @ Front Endocrinol (Lausanne)