IMAGE

Figure 4

ID
ZDB-IMAGE-230712-18
Source
Figures for Gora et al., 2023
Image
Figure Caption

Figure 4

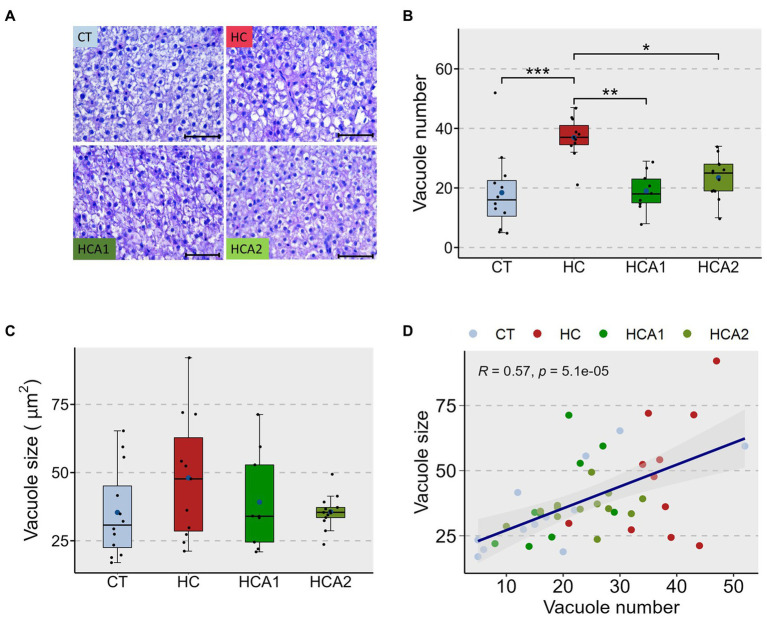
Histomorphology of the liver of zebrafish fed different experimental diets for a period of 12 weeks. Representative histological images (A) of the liver of zebrafish. Dot-plot shows average number (B) and average size (C) of vacuoles in the liver of fish fed control (CT) diet, high cholesterol (HC) diet, HC diet supplemented with lower (HCA1) or higher (HCA2) levels of microbial oil. The scatter plot (D) shows correlation between average vacuole number and average vacuole size in the liver of zebrafish. ***p < 0.001, **p < 0.01 and *p < 0.05. Each treatment group consisted of 9–12 biological replicates. Scale bar = 50 μm.

Acknowledgments
This image is the copyrighted work of the attributed author or publisher, and ZFIN has permission only to display this image to its users. Additional permissions should be obtained from the applicable author or publisher of the image. Full text @ Front Nutr