IMAGE

Figure 1

ID
ZDB-IMAGE-230712-15
Source
Figures for Gora et al., 2023
Image
Figure Caption

Figure 1

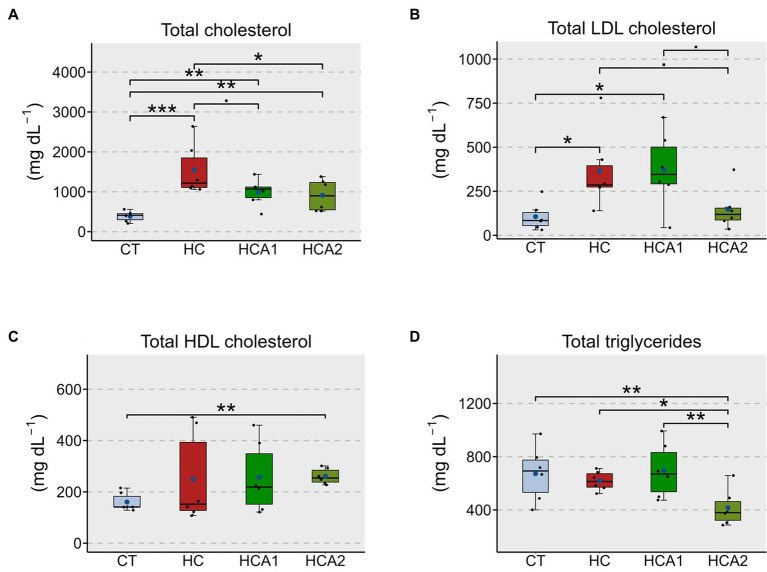
Alteration of the plasma lipids in zebrafish fed different experimental diets for a period of 12 weeks. Boxplots show total cholesterol (A), LDL cholesterol (B), HDL cholesterol (C) and total triglyceride (D) contents in the plasma of the fish. Blue dots inside boxplots indicate the mean values of the corresponding groups. CT-fish fed the control diet; HC-fish fed the high cholesterol diet (5.1% inclusion); HCA1-fish fed microbial oil (3.1% inclusion); HCA2-fish fed microbial oil (6.6% inclusion). ***p < 0.001, **p < 0.01, *p < 0.05, and p < 0.1. Each treatment group consisted of six biological replicates.

Acknowledgments
This image is the copyrighted work of the attributed author or publisher, and ZFIN has permission only to display this image to its users. Additional permissions should be obtained from the applicable author or publisher of the image. Full text @ Front Nutr