
|
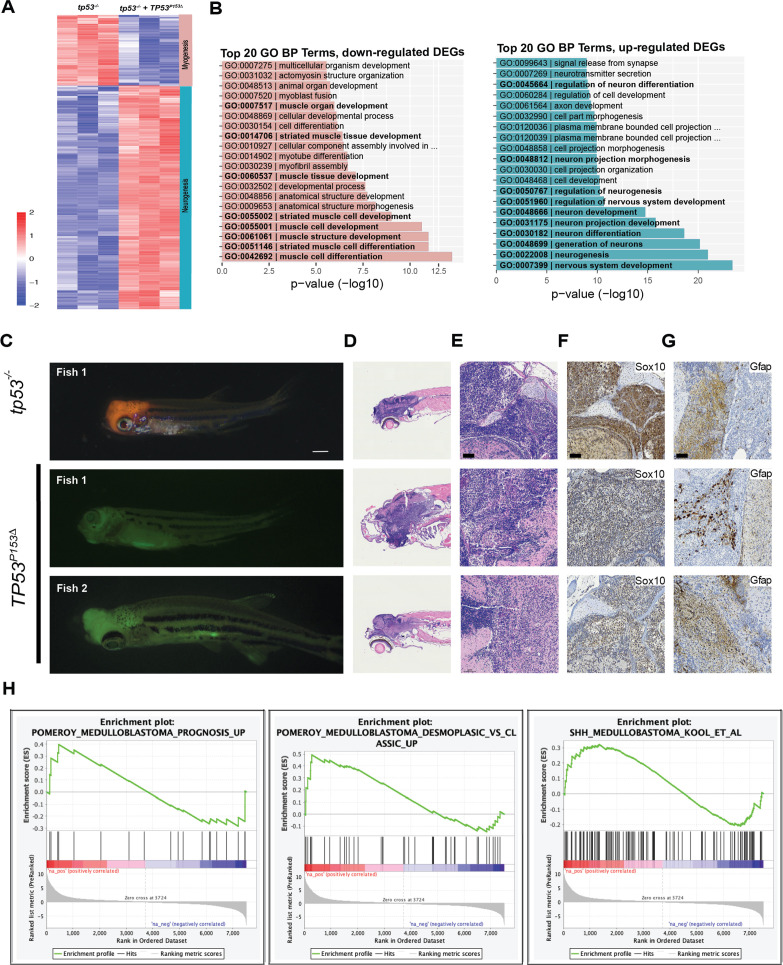
Figure 5 Expression of TP53P153Δ with kRASG12D in tp53-/- zebrafish results in the initiation of medulloblastomas with a shh gene signature. (A) Heatmap from RNAseq analyses comparing tumors expressing kRASG12D;tp53-/- to kRASG12D; tp53-/-; TP53P153Δ (n = 3/group). A total of 643 genes were selected for the heatmap, with adjusted p-value<0.01 and fold-change >10. (B) Enriched Gene Ontology (GO) Biological Processes (BP) in upregulated genes in p53-/- group (left panel with pink bars) consistent with the expected tissue of origin for kRASG12D;tp53-/- to kRASG12D; tp53-/-; TP53P153Δ (right panel with light blue bars). (C) Representative images of medulloblastoma tumors expressing kRASG12D and DsRED (top panel) or GFP (bottom two panels) in tp53-/- fish with or without human TP53P153Δ expression. Tumor-burdened zebrafish are between 30 (Fish 1) and 70 (Fish 2, 3) days old. Scale bar = 1 mm. (D) Representative H&E staining of tumors arising in the head region of tp53-/- fish with or without expression of human TP53P153Δ. Images between 40 and 60 times magnification. (E–G) Representative sections of tumor-burdened zebrafish showing H&E staining (D, E) and IHC staining for Sox10 (F), and Gfap (G) in head tumors expressing kRASG12D in tp53-/- fish or kRASG12D andTP53P153Δ in tp53-/- fish. Scale bar = 60 µm (H) Gene set enrichment analysis (GSEA) showing the enrichment of medulloblastoma gene signatures from Pomeroy et al., and Kool et al., with our zebrafish brain tumors. Log-fold-change derived from the differential expression analysis between tp53-/- and tp53-/-; TP53P153Δ was used with GSEA pre-ranked function (GSEA, v4.0.3, Broad Institute, MA).