
|
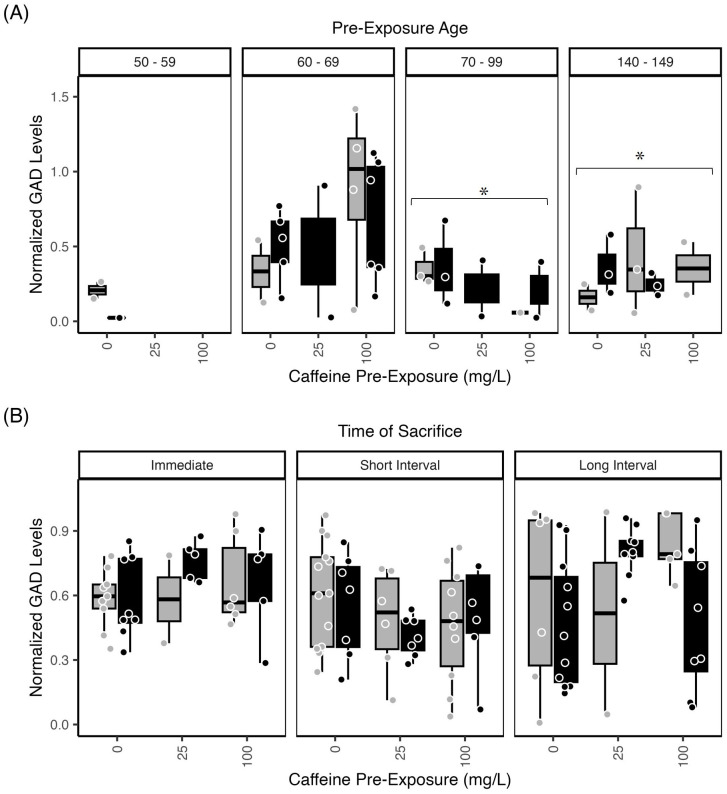
Fig 6 Zebrafish Retinal GAD65/67 levels were affected by caffeine.
Normalized retinal GAD65/67 levels from zebrafish exposed to 1.5% ethanol (black bars) or water/control (gray bars) ± caffeine (0 mg/L; 25 mg/L, 100 mg/L). (A) GAD65/67 levels in retinal tissue measured immediately after pre-exposure were increased in fish exposed from 140–149 dpf compared to 50–69 dpf (p<0.03). Retinal GAD 65/67 levels were also increased in fish exposed from 70–99 dpf compared to 50–69 dpf (p<0.02; asterisk). (B) Retinal GAD65/67 levels assessed across the post-exposure time points did not identify any differences across groups. The boxplots show the minimum, first quartile, median, third quartile, and maximum values for each measure after outliers were removed. Exposure ages (dpf) are indicated across the top of the bar graphs. For retina GAD levels, there were 4–6 independent replicates per treatment condition (each ethanol/caffeine dose) for a total of 35 subjects. ANOVA tables and multiple comparison results for this data can be found in