
|
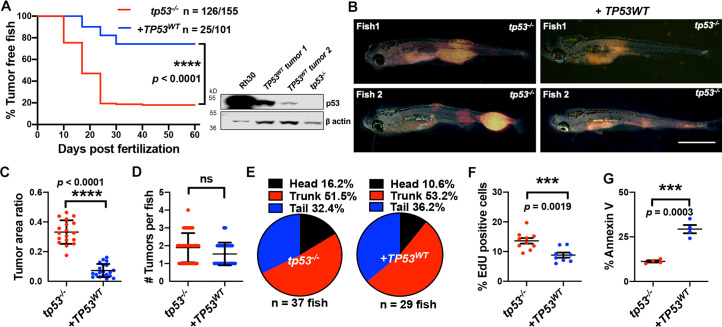
Figure 3 Human TP53 blocks tumor initiation, growth, and proliferation and increases apoptosis in tp53-/- zebrafish. (A) Kaplan–Meier plot showing embryonal rhabdomyosarcoma (ERMS) tumor initiation in tp53-/- fish with or without p53WT expression. Western blot analysis was performed to assess p53WT expression level in tumors. (B) Representative images of ERMS tumors in tp53-/- fish with or without human TP53WT expression. Tumor-burdened zebrafish are between 15 and 20 days old. Scale bar = 1 mm. (C) Ratio of tumor area to total body area in tp53-/- fish with or without expression of TP53WT. n = 18. (D) Number of tumors per tp53-/- zebrafish with or without expression of TP53WT. ns, not significant. n = 36 (tp53-/-), n = 28 (TP53WT). (E) Pie chart showing site of tumor localization in tp53-/- fish with or without expression of TP53WT showing no statistical differences. Head – p=0.20045, trunk – p=0.42858, tail – p=0.3336. Quantification of proliferation (F) and apoptosis (G) via EdU staining (n = 10) and Annexin V staining (n = 3), respectively, for tumors arising in tp53-/- fish with or without expression of TP53WT.