IMAGE

Fig. 3.

ID
ZDB-IMAGE-230621-5
Source
Figures for Lv et al., 2023
Image
Figure Caption

Fig. 3.

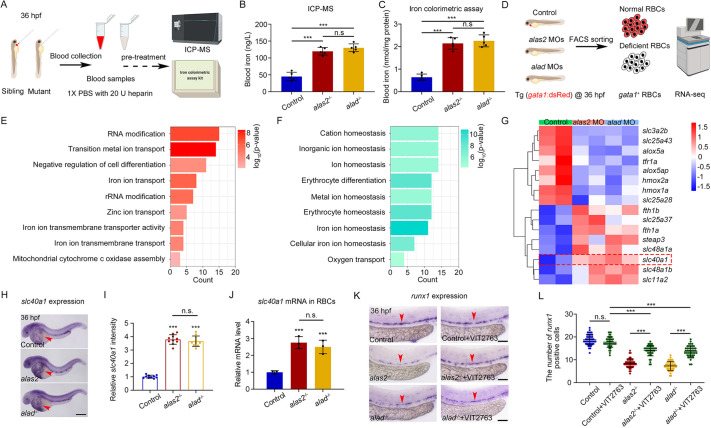
Blood IOL phenotype is caused by heme-deficient RBCs via Slc40a1. (A) Workflow of blood iron measurement in control, alas2−/− and alad−/− at 36 hpf by ICP-MS or iron colorimetric assay kit. (B,C) Quantification of the blood iron content by ICP-MS (B) and iron colorimetric assay kit (C). n=5 experimental replicates. (D) Schematic of bulk RNA-seq of flow cytometry-sorted gata1+ RBCs in alas2 and alad morphants at 36 hpf on Illumina NovaSeq 6000 platform. (E,F) GO analysis showing the enrichment of upregulated (E) and downregulated (F) overlapping terms in heme-deficient RBCs of alas2 and alad morphants. (G) Heatmap analysis of selected overlapping DEGs in iron transportation-related GO terms. The iron exporter Slc40a1 is highlighted with red dashed rectangle. (H) The expression of slc40a1 is detected by WISH in control, alas2−/− and alad−/− at 36 hpf. The RBC-enriched yolk regions are denoted by red arrowheads. (I) Statistical analysis of the relative slc40a1 expression in H by ImageJ. n (embryos)=10. (J) Relative mRNA level of slc40a1 in the flow cytometric-sorted RBCs (gata1+) of control, alas2−/− and alad−/− at 36 hpf examined by qRT-PCR. n=3 experimental replicates. (K) Expression of HSPC marker gene runx1 in control, alas2−/− and alad−/− with or without VIT2763 treatment at 36 hpf examined by WISH. The AGM regions for marker gene-positive cell counting are denoted by red arrowheads. (L) Quantification of the runx1-positive HSPCs in K. n=3 experimental replicates. Number of samples are indicated. Data are mean±s.d. ***P<0.001 (one-way ANOVA, Tukey's multiple comparisons). n.s., not significant. Scale bars: 250 μm (H); 100 μm (K).

Acknowledgments
This image is the copyrighted work of the attributed author or publisher, and ZFIN has permission only to display this image to its users. Additional permissions should be obtained from the applicable author or publisher of the image. Full text @ Development