IMAGE

Fig. 4.

ID
ZDB-IMAGE-230621-1
Source
Figures for Lv et al., 2023
Image
Figure Caption

Fig. 4.

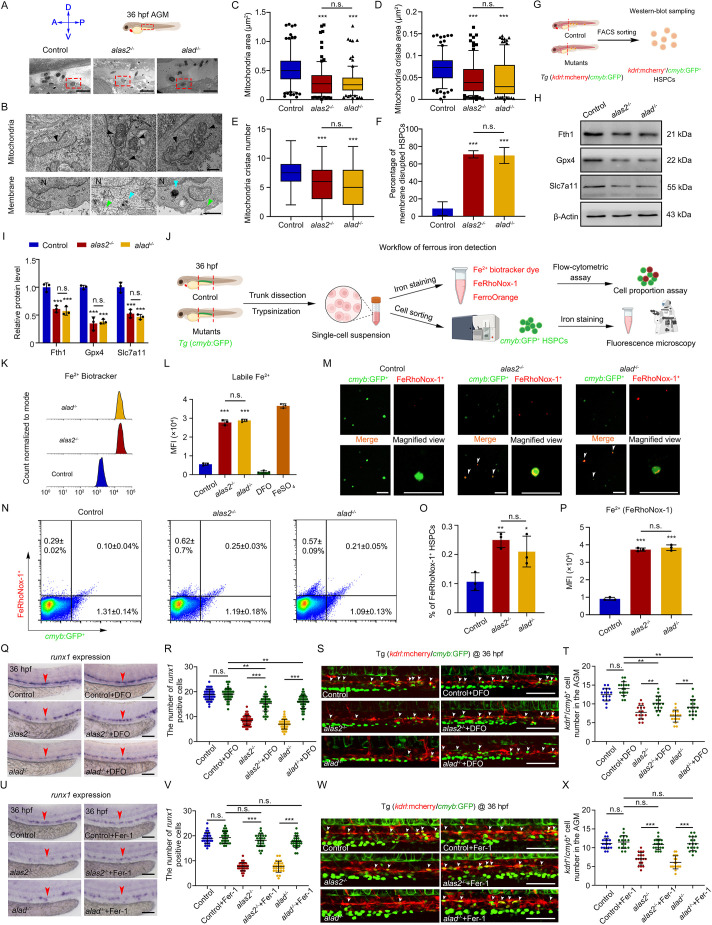
Iron-dependent HSPC ferroptosis in alas2−/− and alad−/−. (A) Transmission electron microscopy (TEM) view of a longitudinal section through the artery and vein in control, alas2−/− and alad−/− AGM region at 36 hpf. (B) TEM view of HSPC subcellular structures. From top to bottom panels are mitochondria and membrane. Arrowheads in black denote mitochondria, green denote plasma membrane and blue denote double-membrane vesicle. (C-E) Quantification of mitochondria area, mitochondria cristae area and cristae number in HSPCs of control, alas2−/− and alad−/−. Box plots show median values (middle bars) and first to third interquartile ranges (boxes); whiskers indicate 1.5 times the interquartile ranges (IQR); individual points from the 10 to 90 percentile are plotted and shown. n (mitochondria)=96. (F) Quantification of membrane-disrupted HSPCs in control, alas2−/− and alad−/−. n (HSPCs)=12. (G,H) Western-blotting detection of the protein level of Fth1, Gpx4 and Slc7a11 in flow cytometric-sorted HSPCs of control, alas2−/− and alad−/− at 36 hpf, respectively (30,000 HSPCs were sorted in each group). (I) Quantification of protein levels in H. Protein levels were analyzed using 8-bit-gray analysis (Gel-Pro analyzer). n=3 experimental replicates. (J) Schematic workflow for the ferrous iron assessment in HSPCs (cmyb+) of alas2−/− and alad−/− with fluorescent iron probes (Fe2+ biotracker dye, FeRhoNox-1 and FerroOrange) at 36 hpf. (K) Representative flow cytometric histogram of the Fe2+ level in sorted HSPCs of control, alas2−/− and alad−/− at 36 hpf measured by Fe2+ biotracker dye. (L) Quantification of mean fluorescence intensity (MFI) of labile Fe2+ level in K. (M) Representative fluorescence images show the co-localization of cmyb:GFP+ and FeRhoNox-1+ cells in alas2−/− and alad−/− at 36 hpf. The cmyb+/FeRhoNox-1+ cells are denoted by white arrowheads. (N) Flow cytometric analysis of the percentage of cmyb+/FeRhoNox-1+ cells in control, alas2−/− and alad−/− at 36 hpf. (O) Statistical analysis of the percentage of FeRhoNox-1+ HSPCs in N. n=3 experimental replicates. (P) Quantification of MFI of Fe2+ level in N. n=3 experimental replicates. (Q) Expression of HSPC marker runx1 in control, alas2−/− and alad−/− with or without DFO treatment (100 μM) at 36 hpf examined by WISH. The AGM regions for marker gene-positive cell counting are denoted by red arrowheads. (R) Quantification of the runx1-positive HSPCs in Q. n=3 experimental replicates. (S) Confocal imaging shows the kdrl+/cmyb+ HSPCs in control, alas2−/− and alad−/− with or without DFO treatment at 36 hpf. (T) Quantification of the HSPCs in S. n=3 experimental replicates. (U) Expression of HSPC marker runx1 in control, alas2−/− and alad−/− with or without Ferrostatin-1 (Fer-1) treatment (10 μM) at 36 hpf examined by WISH. The AGM regions for marker gene-positive cell counting are denoted by red arrowheads. (V) Quantification of the runx1-positive HSPCs in U. n=3 experimental replicates. (W) Confocal imaging shows the kdrl+/cmyb+ HSPCs in control, alas2−/− and alad−/− with or without Fer-1 treatment at 36 hpf. (X) Quantification of the HSPCs in W. n=3 experimental replicates. Number of samples are indicated. Data are mean±s.d. *P<0.05, **P<0.01, ***P<0.001 [one-way ANOVA, Tukey's multiple comparisons (C-F,L,O,P,R,T,V,X); two-way ANOVA, Sidak's multiple comparisons (I)]. n.s., not significant. Scale bars: 10 μm (A); 0.5 μm (B); 50 μm (M); 100 μm (Q,S,U,W).

Acknowledgments
This image is the copyrighted work of the attributed author or publisher, and ZFIN has permission only to display this image to its users. Additional permissions should be obtained from the applicable author or publisher of the image. Full text @ Development