
|
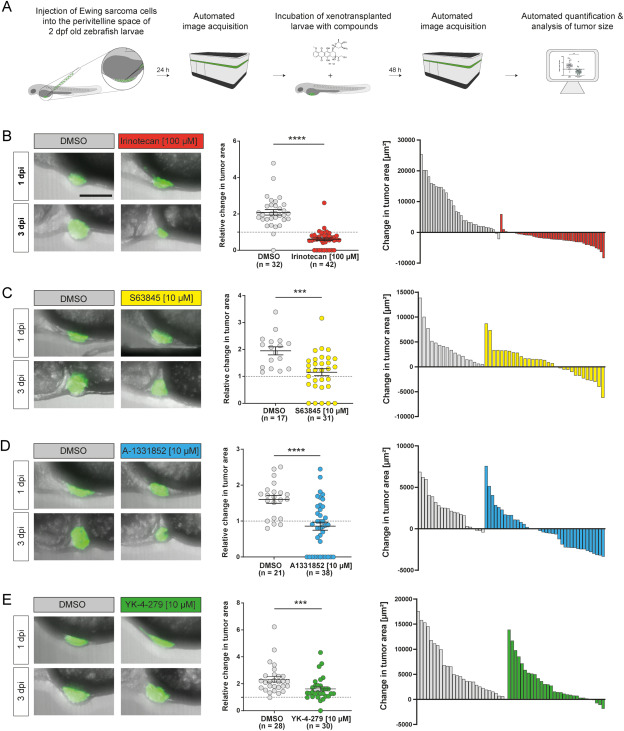
Fig. 3 Fig. 3. Single agent treatment of xenotransplanted larvae A) Schematic representation of the workflow - Zebrafish embryos were xenotransplanted with shSK-E17T Ewing sarcoma cells at 2 dpf. After 24 h (1 dpi) embryos were imaged on the Operetta CLS and subsequently incubated in respective amounts of small compounds. After 48 h (3 dpi) larvae were imaged again and changes in tumor size were analyzed. B-E) Xenotransplanted larvae were treated with irinotecan (100 μM, B), S63845 (10 μM, C), A-1331852 (10 μM, D) and YK-4-279 (10 μM, E) for 48 h (1 dpi - 3 dpi). Dot plots show relative changes of tumor area (3 dpi/1 dpi). Waterfall plots (right panels, 1 bar per zebrafish) total change in tumor area (3 dpi - 1 dpi). Scale bar is 125 μm. Statistical analyses were performed with a Mann-Whitney test, ****: p ≤ 0.0001, ***: p ≤ 0.001. Error bars represent SEM of combined larvae from two independent experiments.