
|
Fig. 3
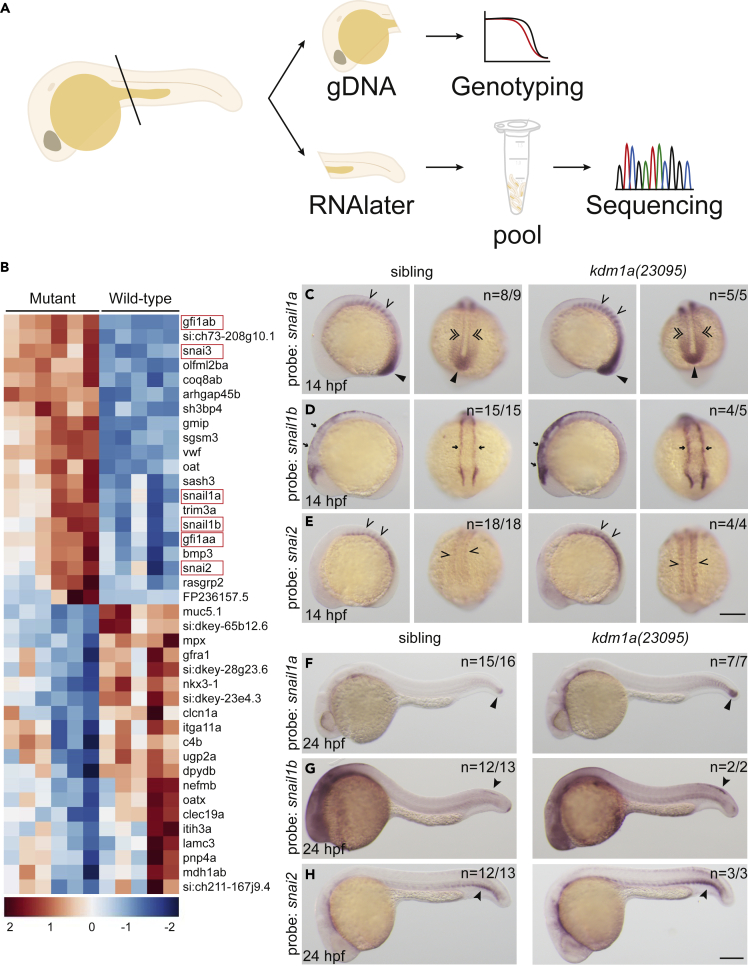
SNAG-domain proteins are dysregulated in lsd1 mutants
(A) Schematic of the sample preparation workflow.
(B) Heatmap of the top 40 differentially expressed genes in kdm1a(23095) and kdm1a(36433) mutants compared to wild-type siblings. SNAG-domain proteins are boxed.
(C–H) WISH of embryos from an incross of kdm1a(23095) heterozygotes for snail1a, snail1b, and snail2 at 14 hpf (C–E), lateral (left) and dorsal (right) views) and 24 hpf (F–H). Representative images are shown with the number of animals with similar staining patterns for the indicated genotype shown in the upper right corner of each image. The lower left corner indicates the approximate stage of the animal at the time of fixation. Embryos were imaged, blindly scored by expression and then genotyped by HRMA. Carons indicate somite expression; narrow triangles indicate tail bud; double carons indicate adaxial cell expression; arrows indicate neural plate border; closed arrowheads indicate trunk neural crest cells (snail1b) or ventral mesoderm (snai2). Scale bar, 200 μm.