IMAGE

Fig. 4

ID
ZDB-IMAGE-230605-40
Genes
Source
Figures for Shukla et al., 2023
Image
Figure Caption

Fig. 4

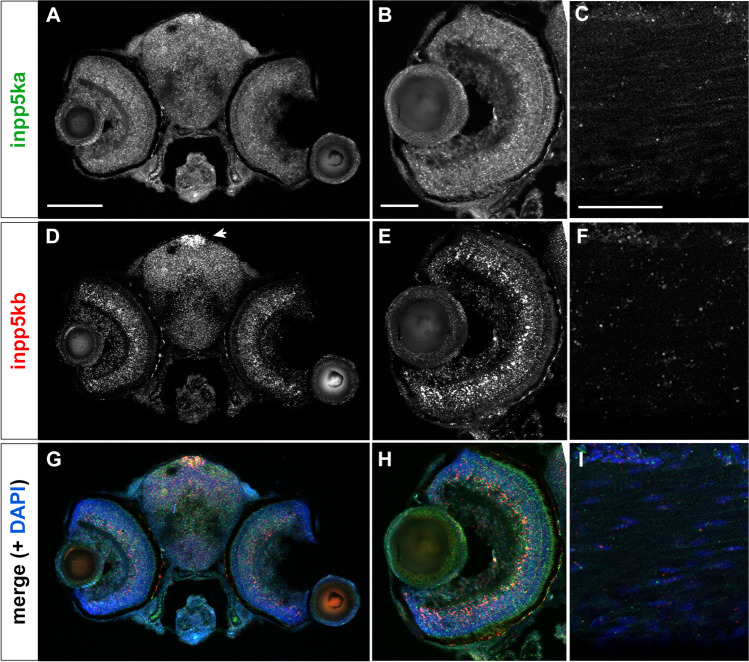
Cellular distribution of inpp5ka and inpp5kb at 5 dpf by RNA scope in situ. A–Cinpp5ka shows even distribution in the brain and eye (A, B), also labeling lens cells (B). Muscle expression is sparse and at lower levels (C). D–Finpp5kb brain expression is highest in the pineal gland (arrow in D). Increased expression is also noted in the inner nuclear layer of the retina with lower expression in photoreceptors, retinal ganglion cells, and lens cells (E, also see Suppl. Figure 1B). Sparse expression is present in muscle cells (F, also see Suppl Fig. 1C). G–I Merged images including both probes (inpp5ka in green and inpp5kb in red) and DAPI to counterstain the nuclei. Scale bars: 100 µm for (A), (D), and (G), 50 µm for all other panels

Figure Data
Acknowledgments
This image is the copyrighted work of the attributed author or publisher, and ZFIN has permission only to display this image to its users. Additional permissions should be obtained from the applicable author or publisher of the image. Full text @ Dev. Genes Evol.