
|
Fig. 1
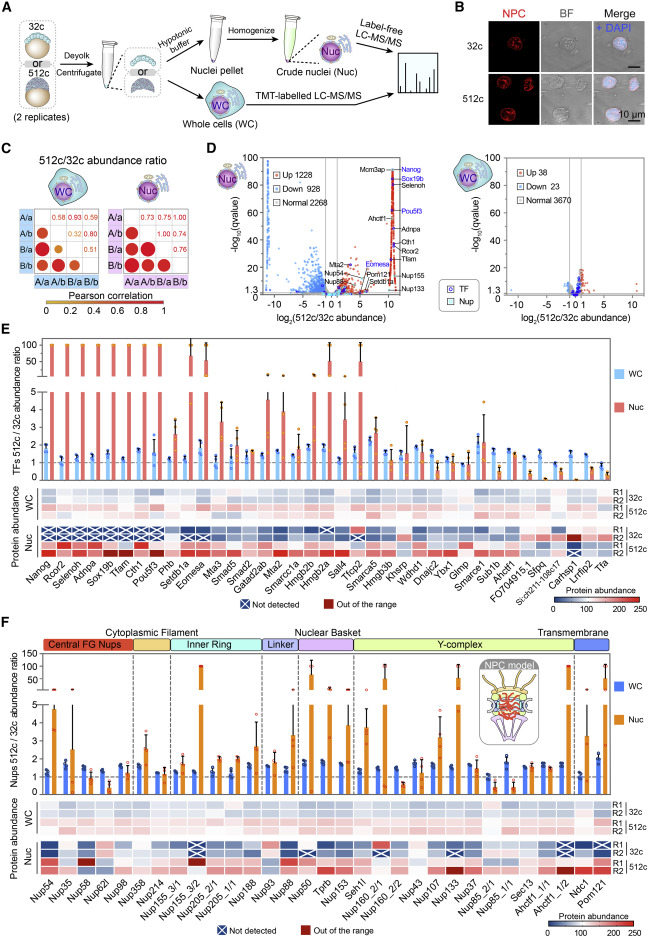
Figure 1. Nuclear protein profiling in zebrafish early embryos by quantitative proteomics (A) Workflow of mass spectrometry for isolated nuclei and whole cells. See also STAR Methods. (B) Examples of isolated nuclei stained with WGA (NPCs) and DAPI (DNA). BF, bright field. (C) Correlation analysis of 512c/32c protein abundance ratios based on Pearson method. A/B and a/b were two biological replicates of 512c and 32c, respectively. (D) Volcano plots of 512c/32c abundance ratio from nuclei (left) or whole-cell proteomic data (right). Differential expression was defined by fold change (512c/32c) >2 or <0.5 and q value < 0.05 (n = 2 replicates). (E and F) Bar plot (top) of 512c/32c abundance ratios and heatmap of relative abundance (lower) of some maternal TFs (E) or NPC components (F). Top, data were shown as mean ± SD from pairwise comparison of 2 replicates in 512c and 32c embryos. Each circle indicated one comparison. See also Table S1
Reprinted from Cell, 185(26), Shen, W., Gong, B., Xing, C., Zhang, L., Sun, J., Chen, Y., Yang, C., Yan, L., Chen, L., Yao, L., Li, G., Deng, H., Wu, X., Meng, A., Comprehensive maturity of nuclear pore complexes regulates zygotic genome activation, 4954-4970.e20, Copyright (2022) with permission from Elsevier. Full text @ Cell