
|
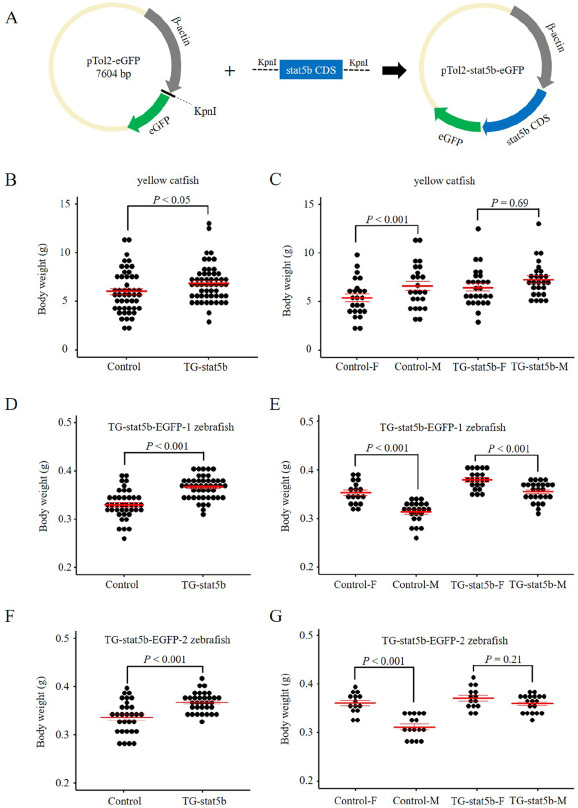
Fig. 5 Growth performance in the control and stat5b transgenic yellow catfish and zebrafish. (A) The construction of transgenic plasmid pTol2-β-actin-stat5b-EGFP. Yellow catfish stat5b gene was inserted into the transgenic plasmid, and pTol2-β-actin- EGFP was used as the control. (B) Comparisons of the body weight in the control and stat5b transgenic yellow catfish at 4-month-old. F0 generation was used. (C) Evaluation of the sexual dimorphism in body weight of the control and stat5b transgenic yellow catfish at 4-month-old. F0 generation was used. (D, F) Comparisons of the body weight in the control and two stat5b heterozygous transgenic zebrafish lines (TG-stat5b-EGFP-1 and TG-stat5b-EGFP-2) at 4-month-old. (E and G) Evaluation of the sexual dimorphism in body weight of the control and two stat5b heterozygous transgenic zebrafish lines (TG-stat5b-EGFP-1 and TG-stat5b-EGFP-2) at 4-month-old. (For interpretation of the references to colour in this figure legend, the reader is referred to the web version of this article.)