
|
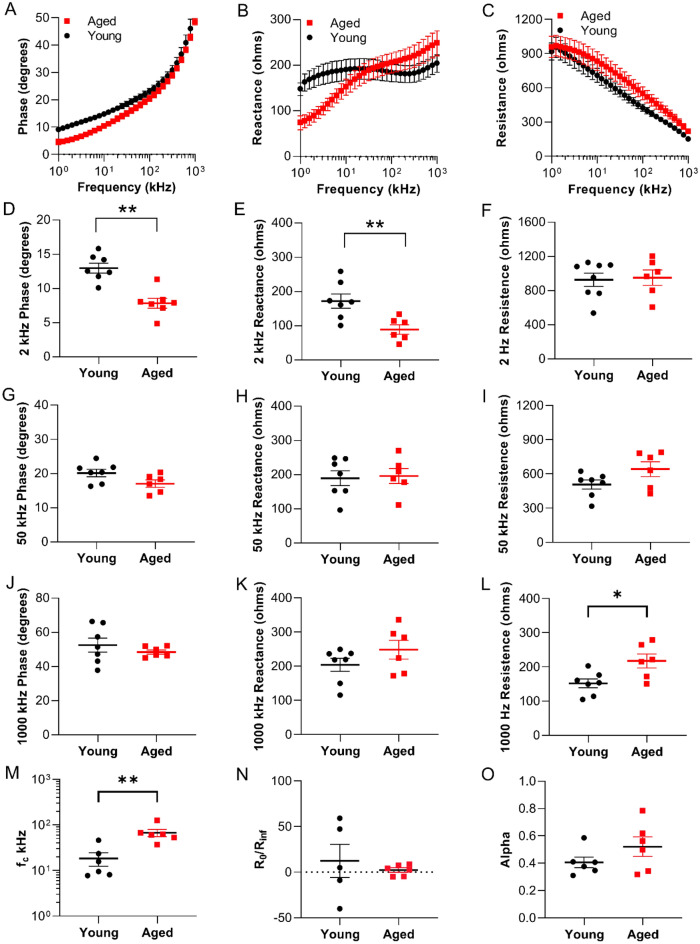
Figure 3
Electrical impedance myography detects age-related muscle changes in zebrafish. Multifrequency graphs (1 kHz–1 MHz) for (A) phase, (B) reactance and (C) resistance. Single frequency analyses at 2, 50 and 1000 kHz. (D) 2 kHz phase (q = 0.0085), (E) 2 kHz reactance (q = 0.0371), (F) 2 kHz resistance, (G) 50 kHz phase, (H) 50 kHz reactance, (I) 50 kHz resistance, (J) 1000 kHz phase, (K) 1000 kHz reactance , (L) 1000 kHz resistance (not FDR significant but nominally significant), (M) Cole parameter fc (q = 0.0181), (N) Cole parameter ratio R0/R∞, and (O) Cole parameter alpha (n = 6–7). Data are presented as mean ± SEM.