
|
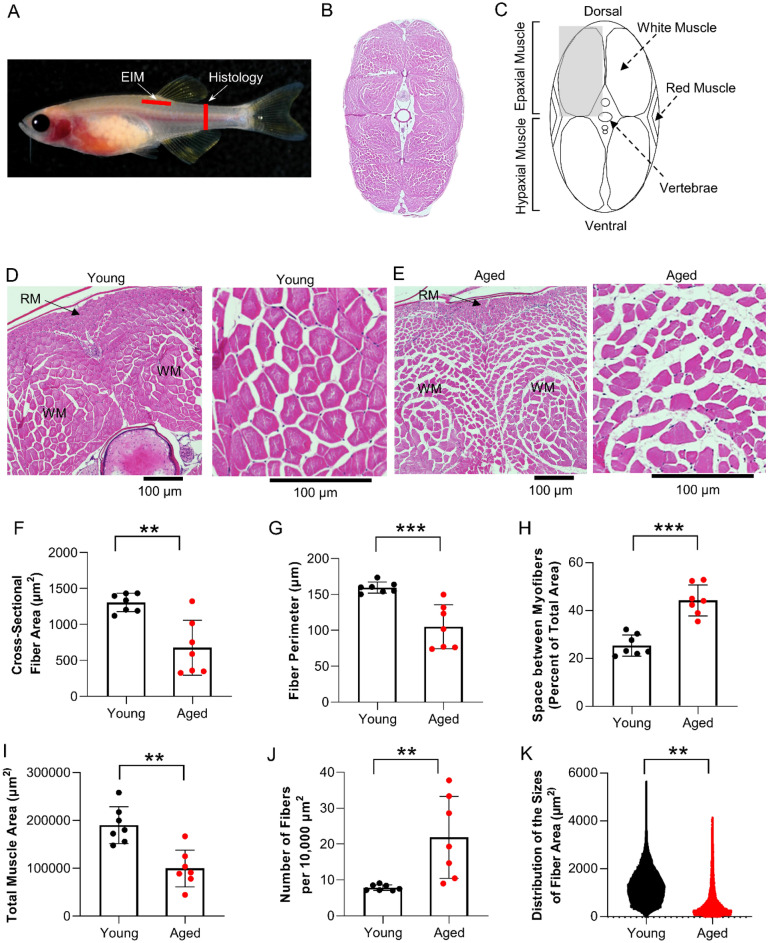
Figure 2
Age-related atrophy of skeletal muscle myofibers in zebrafish. (A) Red bar denotes the cross-sectional position for histological analysis of caudal skeletal muscle tissue, and (B) a representative H&E-stained section of that region. (C) Diagram of caudal musculature in zebrafish including the location of epaxial and hypaxial muscles. The gray box denotes the area used for histological analysis. Representative H&E images from (D) young and (E) aged zebrafish. Muscle fiber morphometric measurements of (F) cross-sectional fiber area (q = 0.0043), (G) fiber perimeter (q = 0.0015), (H) space between myofibers (q = 0.0015), (I) total muscle area (q = 0.0004), (J) number of fibers per unit area (q = 0.0020), and (K) distribution of the sizes of fiber area in young and aged animals (n = 7–8). Data are presented as mean ± SD.