
|
Figure 4
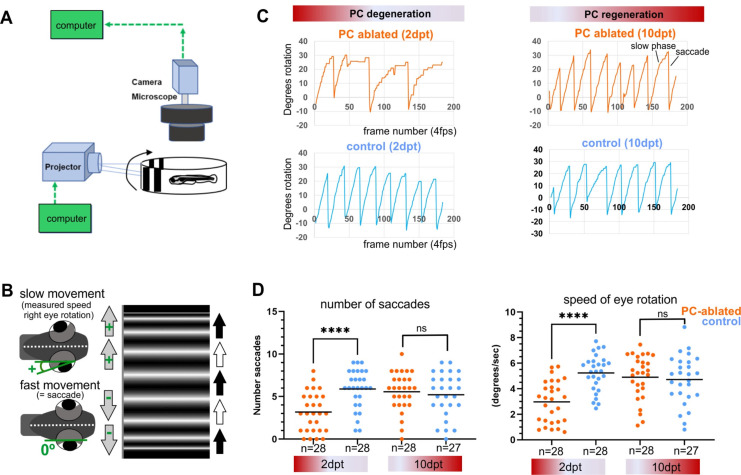
Illustration of OKR setup (A) and eye movements in larvae (B) during performance of the OKR test. (C) Representative graphs showing OKR response performance during acute PC degeneration (2 dpt) and regeneration (10 dpt) phases in PC-ablated (4-hydroxy-tamoxifen [4-OHT] treated) vs control group (EtOH treated). (D) Quantification of OKR response: number of normal saccades (eye rotation >19.5°) and speed of eye rotation during slow phase movements at 2 and 10 dpt. The data correspond to the results of two independent trials that were pooled. Statistical information: statistical method=Mann-Whitney test or unpaired t-test, two tailed, level of significance=P<0.0001 (****). Additional information in Supplementary file 1.
Visuo-motor behavior analysis: optokinetic response (OKR) after induced Purkinje cell (PC) ablation in larvae.