
Image
|
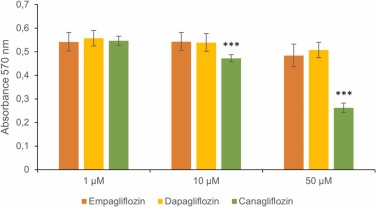
Figure Caption
Fig. 7 Cell viability in response to SGLT2 inhibitor treatments using the MTT assay. The effect of canagliflozin and empagliflozin were compared with treatments with respective concentrations of empagliflozin (n = 3 for each treatment). The results shown are representatives of three separate experiments. Data were presented as mean + SD. *** P < 0.001.
Acknowledgments
This image is the copyrighted work of the attributed author or publisher, and
ZFIN has permission only to display this image to its users.
Additional permissions should be obtained from the applicable author or publisher of the image.
Full text @ Biomed. Pharmacother.