
Image
|
Figure Caption
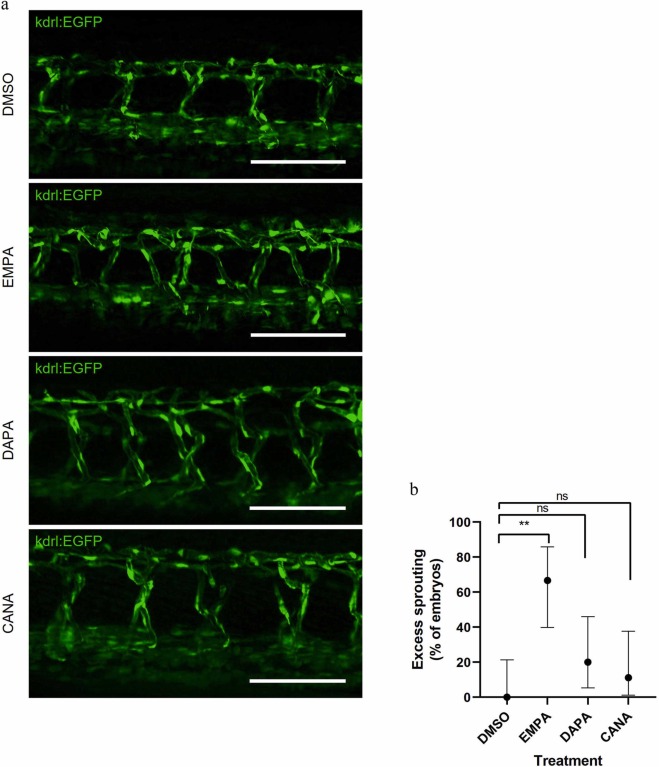
Fig. 3 a Transgenic kdrl:EGFP zebrafish embryos were treated with inhibitors from 23 hpf to 54 hpf and fixed. The samples were imaged with light-sheet fluorescence microscope. Representative images of the sprouting are shown. Scale bar 100 µm.(3b) Quantification of excess sprouting in the embryos. Statistical analysis using Fisher’s exact test, error bars produced with Wilson/Brown algorithm. DMSO, n = 10 embryos; EMPA (50 µM empagliflozin), n = 9 embryos; DAPA (50 µM dapagliflozin), n = 10 embryos; CANA (50 µM canagliflozin), n = 9 embryos. **P < 0.01, ns=non-significant.
Acknowledgments
This image is the copyrighted work of the attributed author or publisher, and
ZFIN has permission only to display this image to its users.
Additional permissions should be obtained from the applicable author or publisher of the image.
Full text @ Biomed. Pharmacother.