
|
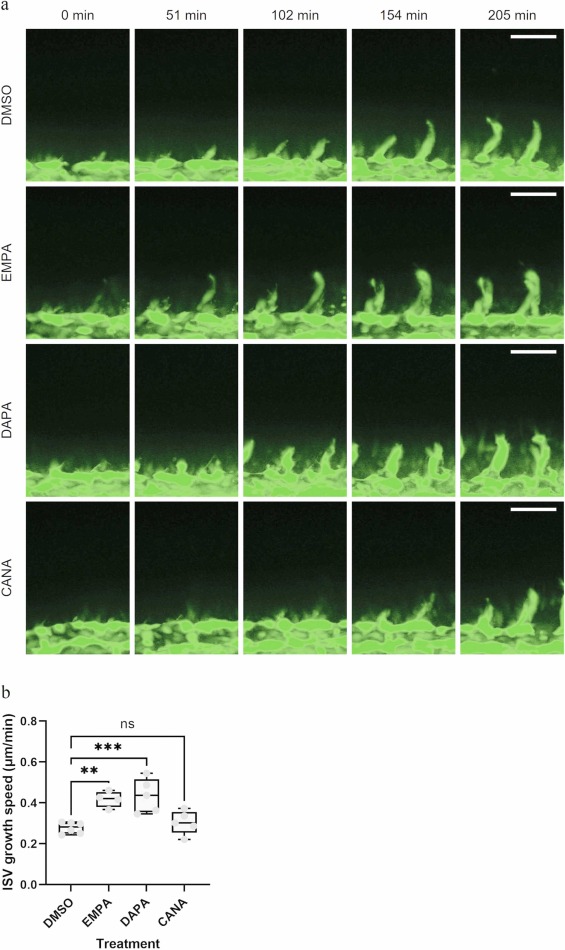
Fig. 2 a Transgenic fli1a:EGFP, roy, mitfa fish were anesthesized, immobilized in agarose and imaged from 23 hpf to 27 hpf. Maximum projections of the representative images from 0 to 205 min are shown. Scale bar 50 µm (2b) The elongation speed of ISVs was quantified and analyzed using one-way ANOVA and Dunnett´s post hoc test. Average speed per embryo was used and are presented in the graph. DMSO [solvent control, n = 6 embryos (23 ISVs), EMPA (50 µM empagliflozin, n = 4 embryos (13 ISVs), DAPA (50 µM dapagliflozin, n = 5 embryos (18 ISVs), CANA (50 µM canagliflozin, n = 5 embryos (14 ISVs)]. ***P < 0.001, **P < 0.01, ns=non-significant.