
|
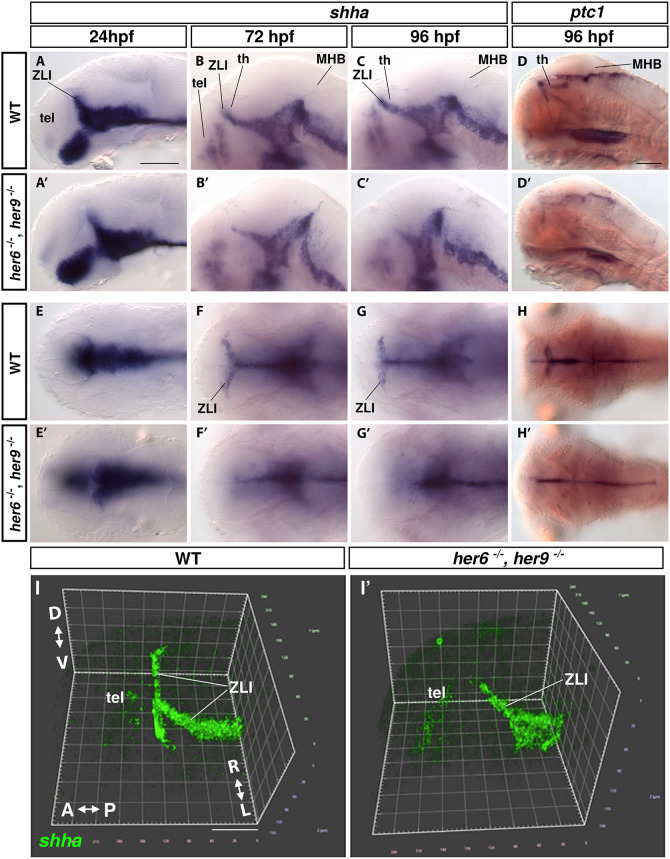
Fig. 5.
Loss of ZLI shha expression in her6, her9 double mutants. (A-H′) WISH showing shha and ptc1 expression in WT and her6, her9 double mutants. For single mutants, see Fig. S10. (A-D′) Lateral views: single sagittal image planes at the midline. (E-H′) Dorsal views: single horizontal image planes at the level of the thalamus. (I,I′) 3D volume reconstruction of fluorescent WISH of shha in 72 hpf WT (I) and her6, her9 double mutant (I′). A-P, anterior-posterior; D-V, dorsal-ventral; MHB, midbrain-hindbrain boundary; R-L, right-left; tel, telencephalon; th, thalamus; ZLI, zona limitans intrathalamica. Scale bars: 100 µm (A for A-C′,E-G′; D for D,D′,H,H′); 60 µm (I for I,I′).