
|
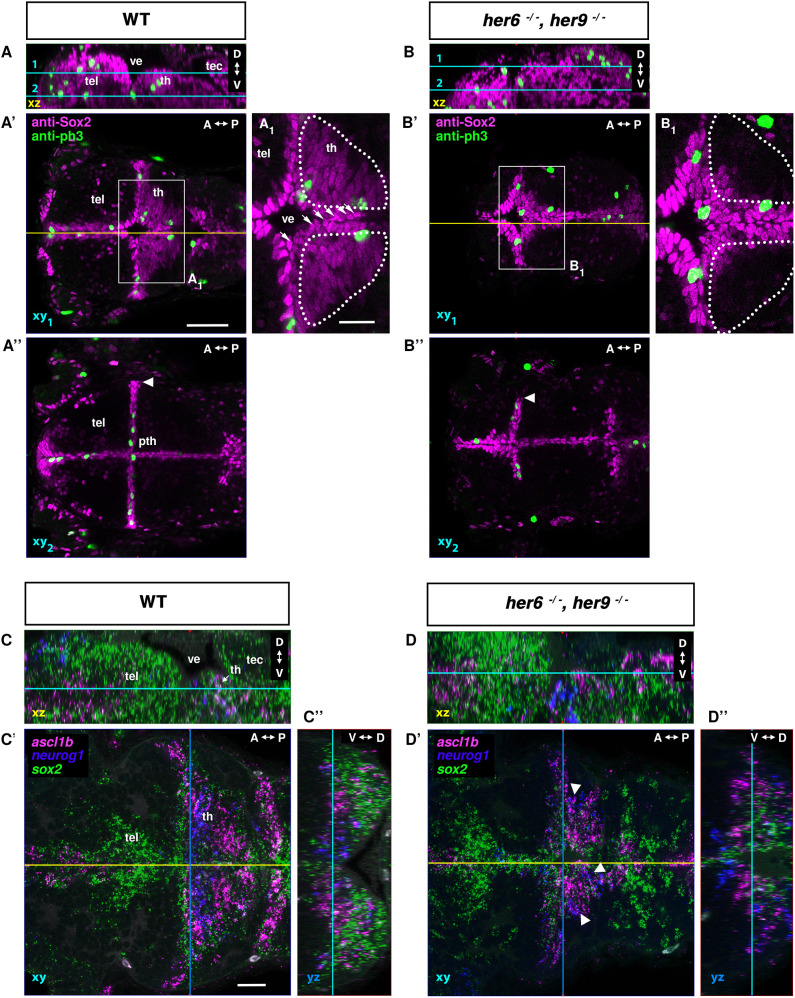
Fig. 4.
NSC and NPC phenotypes in her6, her9 double mutants. (A-B″) Confocal image stacks of anti-Sox2 and anti-pH3 immunofluorescence of 72 hpf WT control (A) and her6, her9 double mutants (B) (see Movie 2). (C-D″) HCR-RNA FISH for detection of sox2, ascl1b and neurog1 expression. (A-D) Lateral view midline sagittal xz plane from orthogonal reconstructions. Cyan lines show dorsal view horizontal confocal planes 1 and 2 shown in A′-D′, A″,B″ (A′,B′ dorsal part of the diencephalon with the thalamus proper; A″,B″ more ventrally including the prethalamus). Yellow lines in A′-D′ show midline sagittal planes in A-D. A1 and B1 show magnifications of the boxed areas in A′ and B′. (C′,D′) Blue lines show level of frontal orthogonal reconstructions in C″ and D″ (at level of the lateral expansion of the ventricle). Arrowheads in A″ and B″ indicate the lateral expansion of ventricular Sox2high cells. Arrowheads in D′ indicate the compacted expression domain of neurog1 and ascl1b in NPCs of the mutant. A-P, anterior-posterior; D-V, dorsal-ventral; pth, prethalamus; tec, tectum opticum; tel, telencephalon; th, thalamus; ve, ventricle. Scale bars: 50 µm; 20 µm (A1,B1,C′).