
|
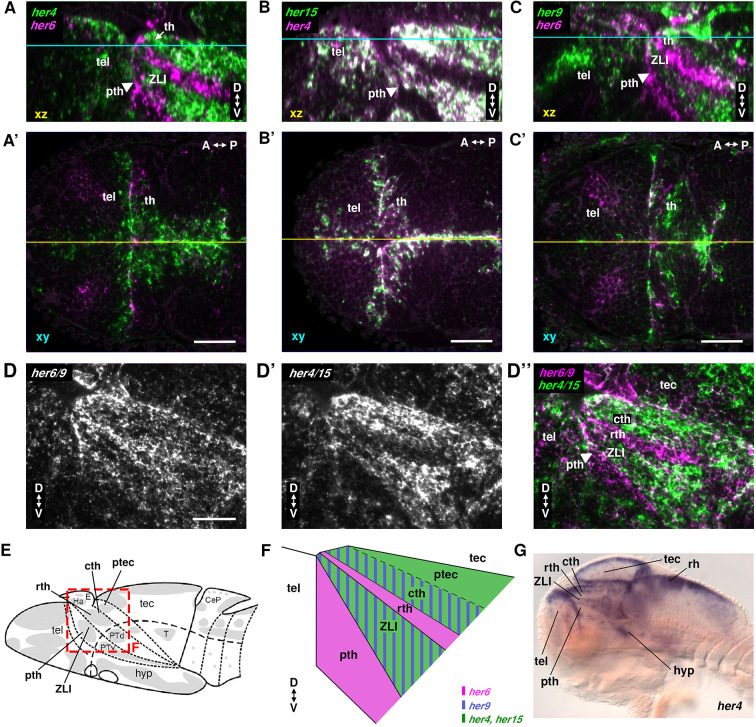
Fig. 2.
Co-expression analysis of her genes in the thalamic complex. (A-D″) Confocal imaging of double-fluorescent WISH at 72 hpf, probes and colors as indicated. (A-C) Lateral views of midline sagittal orthogonal reconstructions of dorsal view horizontal stacks (levels: yellow line in A′-C′). (A′-C′) Dorsal views, optical horizontal section level indicated in cyan in A-C. (D-D″) Lateral views of combined her6/her9 (her6 and her9 probes mixed) and combined her4/her15 (her4.1-4.5 and her15.1-15.2 probes mixed). (E) Schematic of a 3 dpf zebrafish larval brain (Mueller and Wullimann, 2016). Gray, proliferation zones; dashed line, alar-basal boundary. Red box indicates the thalamic complex, shown enlarged in F. (F) Schematic of her gene expression domains at the ventricular wall of the alar diencephalon. Striped areas indicate that genes are co-expressed or expressing cells intermingled. (G) her4 WISH 72 hpf larva, sagittal optical section. A-P, anterior-posterior; CeP, cerebellar plate; cth, caudal thalamus; D-V, dorsal-ventral; E, epiphysis; Ha, habenula; hyp, hypothalamus; PTd, dorsal part of posterior tuberculum; ptec, pretectum; pth, prethalamus; PTv, ventral part of posterior tuberculum; rh, rhombencephalon; rth, rostral thalamus; T, midbrain tegmentum; tec, tectum opticum; tel, telencephalon; th, thalamus; ZLI, zona limitans intrathalamica. Scale bars: 50 µm.