
|
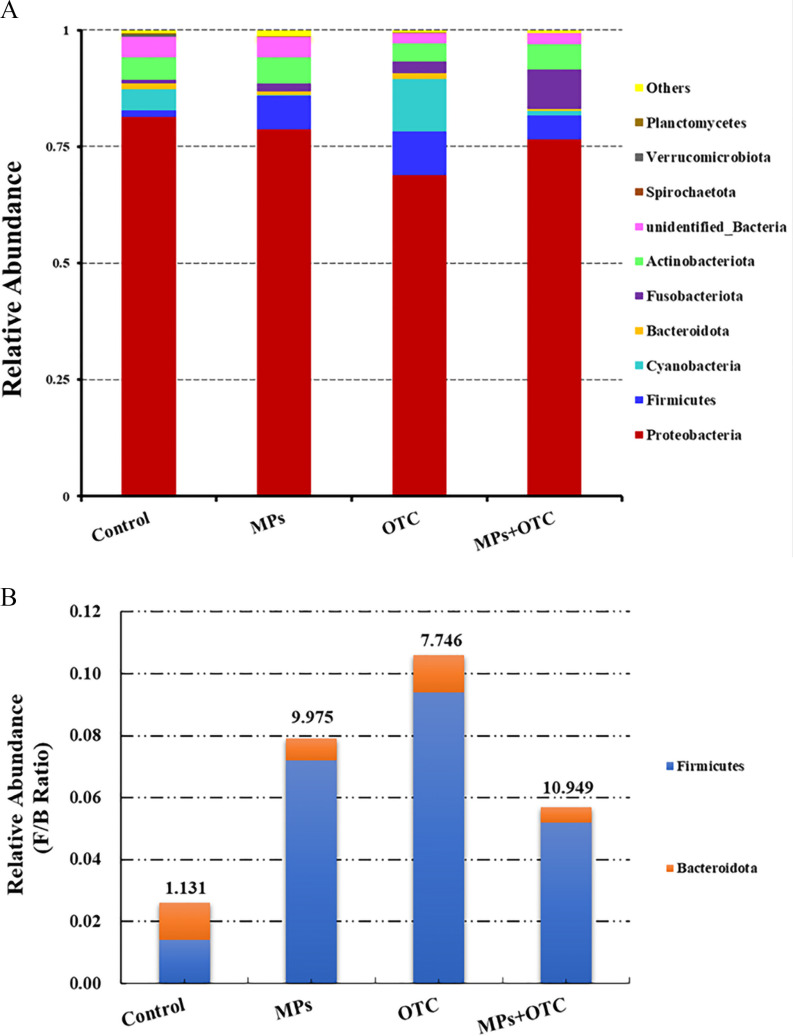
Figure 6. The (A) top 10 abundant microbial phyla and the (B) Firmicutes/Bacteroidetes ratios of the gut content microbiome of zebrafish after 28-d exposure to control, MPs, OTC, and MP-OTC, respectively (n=3 for each experimental group). Microbiome of gut contents (under accession number of PRJNA890774 in NCBI database) were obtained by Illumina-based high-throughput sequencing (Novogene Co., Ltd.). Different microbial phyla are labeled with different colors and corresponding phyla names are listed on the right side in (A). Blue and orange colors in (B) indicate the relative abundance of Firmicutes and Bacteroidetes, respectively. The corresponding numeric data for (A) are provided in Table S9. The number above each data column in (B) indicates the Firmicutes/Bacteroidetes ratio for the corresponding experimental group. Note: F/B, Firmicutes/Bacteroidetes (ratio); MP-OTC, microplastics and oxytetracycline; MPs, microplastics; NCBI, National Center for Biotechnology Information; OTC, oxytetracycline.