
|
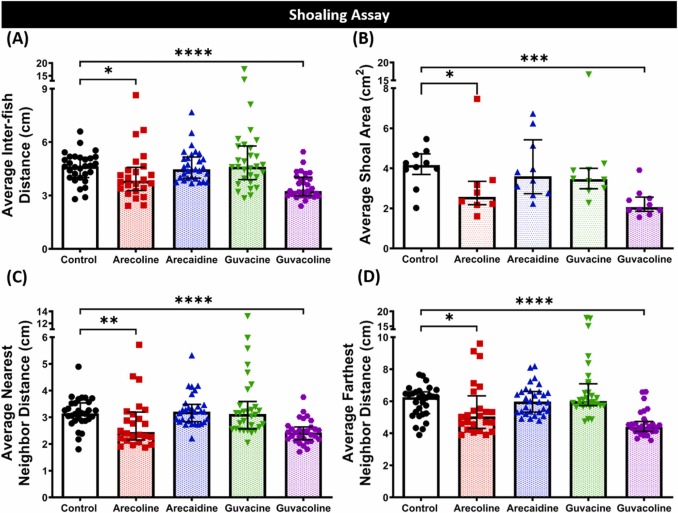
Fig. 3 Fig. 3. Comparison of behavior endpoints between untreated control, arecoline, arecaidine, guvacine, and guvacoline exposed zebrafish in shoaling tests. (A) Average inter-fish distance, (B) average shoal area, (C) average nearest neighbor distance, and (D) average farthest neighbor distance were analyzed. The data are expressed as the median with interquartile range and were analyzed by Kruskal-Wallis test continued with uncorrected Dunn’s test (n = 30 for the control, arecaidine, guvacine, and guvacoline treatment groups; n = 24 for arecoline treatment groups, * P < 0.05, ** P < 0.01, *** P < 0.001, **** P < 0.0001). Each shoal consists of three fish in one tank.