
|
Fig. 6
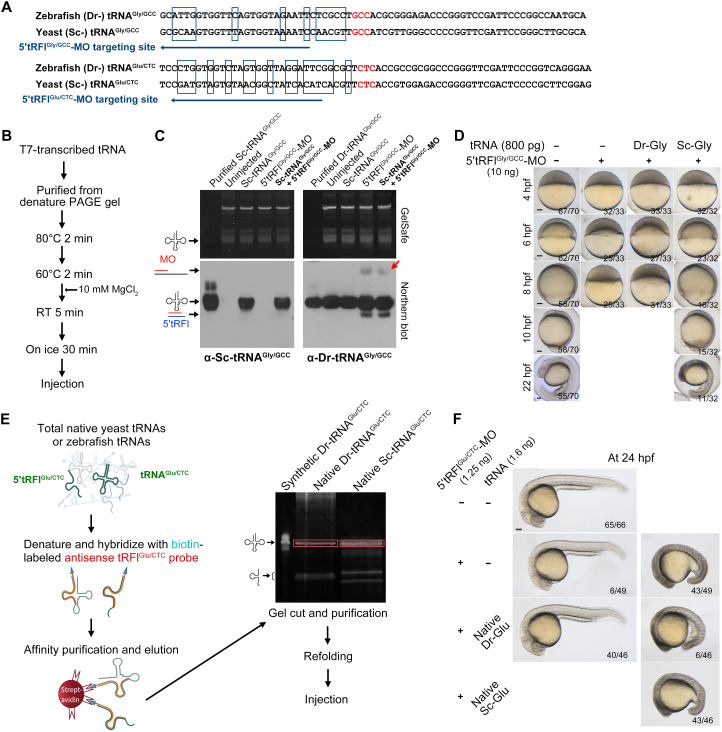
(A) Sequence comparison between zebrafish (Danio rerio, Dr) and yeast (Saccharomyces cerevisiae, Sc) tRNAGly/GCC or tRNAGlu/CTC. The mismatched bases are boxed. The MO-targeted sequences are indicated by arrows. (B) Procedures for in vitro tRNA transcription using the T7 RNA polymerase and subsequent purification and refolding. RT, room temperature. (C) Disability of 5′tRFlGly/GCC-MO binding to Sc-tRNAGly/GCC in zebrafish embryos as detected by Northern blotting. Ten nanograms of 5′tRFlGly/GCC-MO and/or 800 pg of tRNAGly/GCC (per embryo) was injected into 1c stage embryos, and embryos were harvested at 2.5 hpf for extraction of total RNAs. Synthetic tRNAGly/GCC was directly loaded onto the gel, serving as molecular markers. RNAs on blots were probed using digoxigenin-labeled antisense Sc-tRNAGly/GCC oligo (left bottom) or antisense Dr-tRNAGly/GCC-LNA oligo (right bottom). The endogenous Dr-tRNAGly/GCC/5′tRFlGly/GCC-MO complex is indicated by a red arrow (right bottom). (D) Sc-tRNAGly/GCC rescues the lethal phenotype of 5′tRFl Gly/GCC morphants. (E) Procedure for isolation of native Dr-tRNAGlu/CTC and Sc-tRNAGlu/CTC. The starting material was purchased yeast crude tRNA extracts or total tRNAs extracted from zebrafish embryos. Biotin-labeled antisense Sc-tRNAGlu/CTC or Dr-tRNAGlu/CTC oligo was used to pull-down specific tRNAGlu/CTC molecules, which were enriched by streptavidin beads. The isolated tRNAGlu/CTC molecules were subjected to gel separation, gel cut (boxed), elution, and refolding. (F) Effective rescue of 5′tRFlGlu/CTC morphants by native Dr-tRNAGlu/CTC but not Sc-tRNAGlu/CTC. 5′tRFlGlu/CTC-MO (1.25 ng per embryo) alone or together with purified native Dr- or Sc-tRNAGlu/CTC (1.6 ng per embryo) was injected into 1c stage embryos, followed by morphological observation at 24 hpf. The ratio of embryos with the representative morphology is indicated. Scale bars, 100 μm (for embryos).