
|
Fig. 3
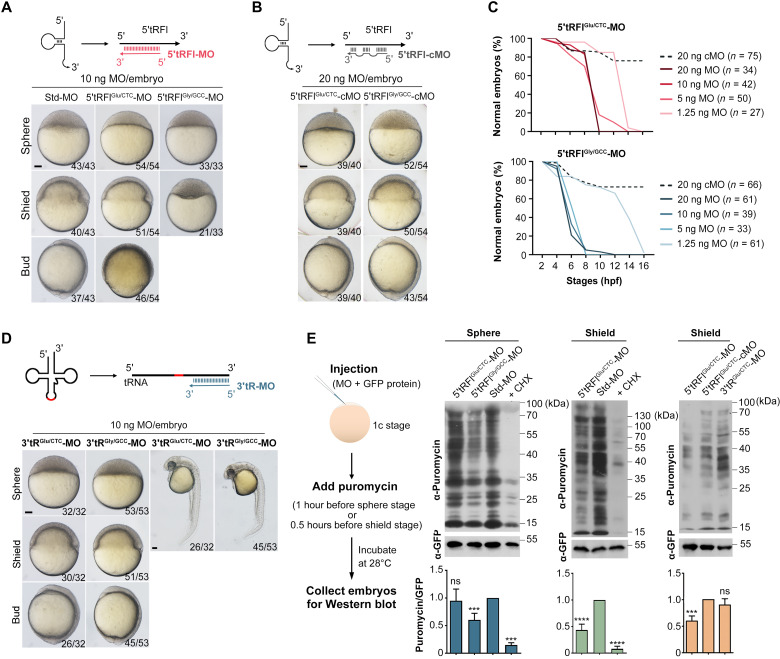
(A) Knockdown effect of 5′tRFlGlu/CTC and 5′tRFlGly/GCC. The binding region of MO in 5′tRFl is illustrated on top. All embryos were laterally viewed. The ratio of representative embryos was indicated on the right bottom. Note that 5′tRFlGly/GCC morphants could not develop beyond the shield stage, and most 5′tRFlGlu/CTC morphants died right after the bud stage. (B) Mismatch control MOs induced no obvious phenotype. The complementarity of cMO to 5′tRFl is illustrated on top. (C) Dose-dependent effects of 5′tRFlGlu/CTC-MO (top) and 5′tRFlGly/GCC-MO (bottom) on embryonic development. Normal embryos were those that had no obvious morphological defects. n, embryo number at the start of observation. (D) Injection of 3′tRGlu/CTC-MO or 3′tRGly/GCC-MO leads to no obvious phenotype. The binding region of 3′tR-MOs is illustrated on top. (E) Puromycin-incorporated nascent proteins are reduced in 5′tRFlGlu/CTC or 5′tRFlGly/GCC morphants. Left: Experimental procedure. Purified GFP protein injected at 6 ng per embryo served as an internal control. Right top: Western blot results at indicated stages using anti-puromycin or anti-GFP antibody. Molecular weight markers are shown on the right side. CHX, cycloheximide, a translation inhibitor. Right bottom: Relative puromycin/GFP ratio normalized to that in the Std-MO group. Data are shown in averages with ±SD from three independent experiments. ns, nonsignificant with P > 0.05; ***P < 0.001; ****P < 0.0001 (Student’s t test, two-tailed). Scale bars, 100 μm (for zebrafish embryos).