
|
Fig. 1
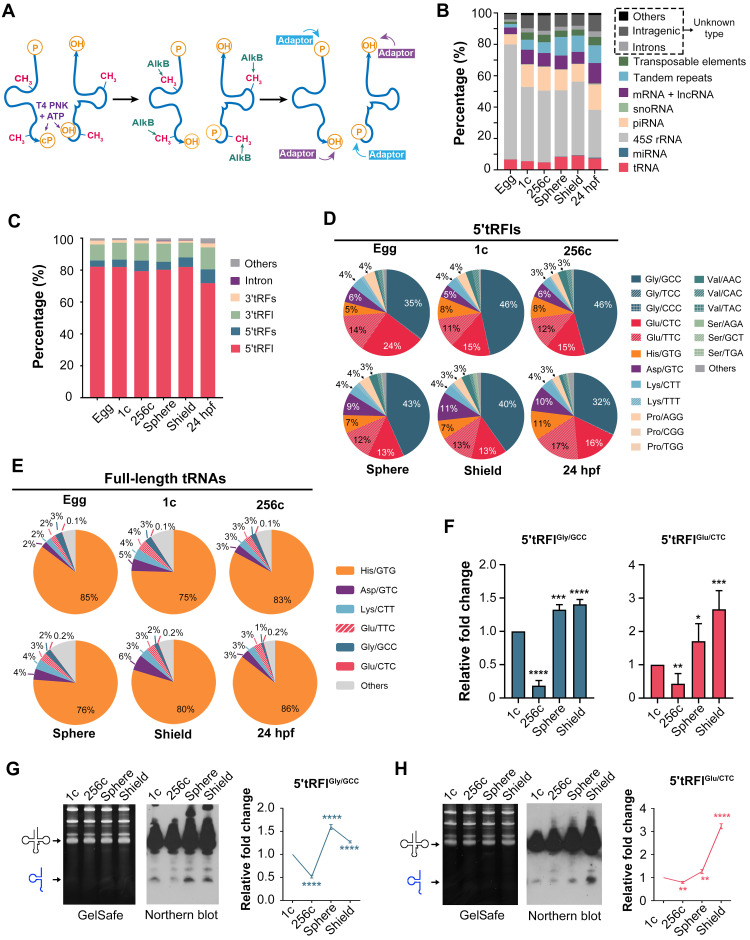
(A) Principle of small RNA pretreatments for library construction. Only tRNAFs are shown. P, phosphate group; cP, 2′3′-cyclic phosphate group; OH, hydroxyl group; ATP, adenosine 5′-triphosphate. (B) Proportion of different types of small RNAs in zebrafish embryos. Small RNAs were aligned to different databases, and the unknown types were mapped to the genome. lncRNA, long noncoding RNA. (C) Percentages of different types of tRNAFs based on their cleavage sites, showing the dominance of long 5′tRFls. (D) Percentages of different 5′tRFls based on their original isoacceptors or isodecoders. (E) Percentages of full-length tRNAs. (F) RT-qPCR verification of 5′tRFlGly/GCC and 5′tRFlGlu/CTC expression levels from 1c to shield stage. Expression levels at later stages were normalized to that at the 1c stage. (G and H) Northern blot verification of 5′tRFlGly/GCC (G) and 5′tRFlGlu/CTC (H) expression levels from 1c to shield stage. Left: GelSafe staining of urea polyacrylamide gel electrophoresis (PAGE) gel with indicated full-length tRNA and 5′tRFl positions. Middle: Northern blot detected by locked nucleic acid (LNA) probe against tRNA/5′tRFlGly/GCC (G) or tRNA/5′tRFlGlu/CTC (H). Right: Average 5′tRFl level with ±SD from three independent experiments. *P < 0.05; **P < 0.01; ***P < 0.001; ****P < 0.0001 (Student’s t test, two-tailed).