
|
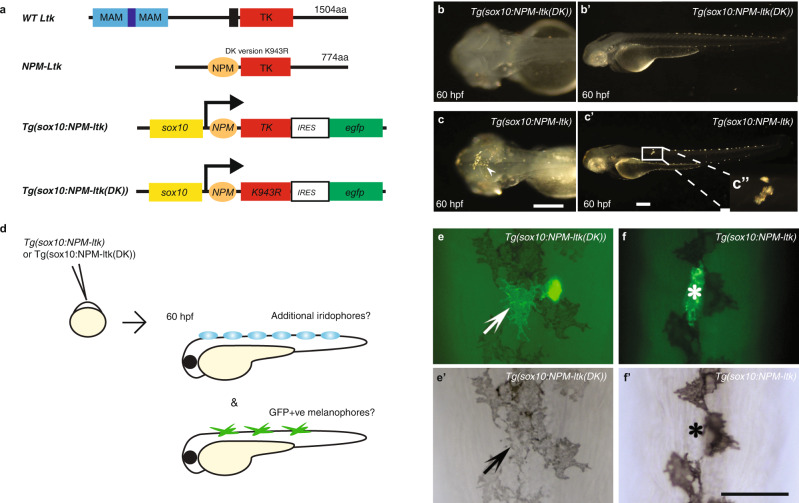
Fig. 4
a, Schematic drawings of wild-type Ltk and NPM-Ltk fusion protein, and of NC expression construct Tg(sox10:NPM-ltk); see text for details of these and of negative control kinase dead construct, Tg(sox10:NPM-ltk(DK)). b-c’, Validation of constitutively-activated Ltk and dead kinase control. Embryos injected with sox10:NPM-ltk DK (b, b’) and Tg(sox10:NPM-ltk) (c, c’), imaged at 60 hpf. Precocious (arrowhead in c) and ectopic (inset c”) iridophores are shown. Melanisation was inhibited by PTU treatment to enhance detection of iridophores. b, c Dorsal views with anterior to the left. b’, c’ left side views with dorsal to the top. Scale bars: 100 µm. d-f ’, Ltk activity is inconsistent with melanocyte differentiation. d, Schematic drawing of experimental procedure. DNA constructs were injected into embryos at 1-cell stage. Embryos were cultured until 60 hpf, scored for precocious/ectopic iridophore formation, and subjected to anti-GFP antibody staining. e-f ’, GFP-positive melanophore in control embryos injected with Tg(sox10:NPM-ltk(DK)) (arrows in e, e’); a second GFP-positive cell was an iridophore based upon its position and shape. In embryos injected with Tg(sox10:NPM-ltk), GFP-positive cells were almost invariably not melanised (asterisks in f, f ’). All views show dorsal midline, anterior to the top. Panels e and f are fluorescent images merged with bright field images and