
|
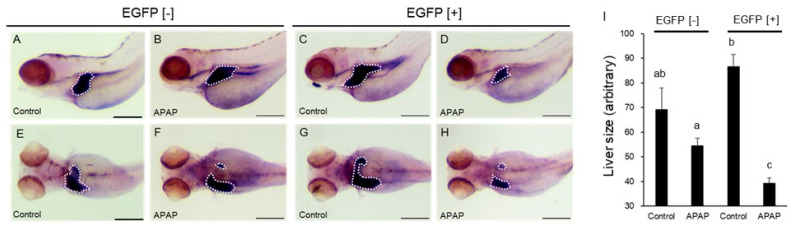
Figure 5
Acetaminophen-induced reduction in the size of the expression area of a hepatocyte marker in rat CYP2E1-TG larvae. EGFP fluorescence-negative (EGFP [−]) and -positive (EGFP [+]) F2 rat CYP2E1-transgenic larvae were exposed to 2.5 mM acetaminophen (APAP) from 48 hpf to 96 hpf. The larvae were fixed for whole-mount in situ hybridization with a fabp10a probe, a hepatocyte marker. The white-dotted circle indicates an outline of the liver. (A,B,E,F): EGFP [−] larvae. (C,D,G,H): EGFP [+] larvae. (E–H) are dorsal images of larvae of (A–D), respectively. Scale bar: 200 µm. (I) indicates averages of the expression area from a dorsal view for each treatment (n = 10 or 12). Bars with different letters in I (a, ab, b, c) are significantly different (p < 0.05).