
|
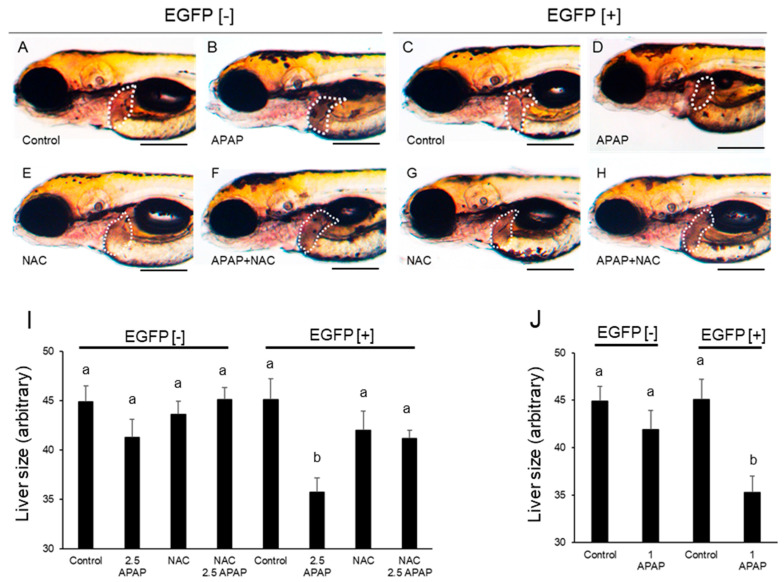
Figure 4
Acetaminophen-induced reduction in the size of the liver in rat CYP2E1-TG larvae and effects of N-acetylcysteine. EGFP fluorescence-negative (EGFP [−]) and -positive (EGFP [+]) F2 CYP2E1-transgenic larvae were exposed to acetaminophen (APAP) from 48 hpf to 96 hpf for capture of lateral images (A-H). The white-dotted circle indicates the liver. (A,B,E,F): EGFP [−] larvae. (C,D,G,H): EGFP [+] larvae. Some larvae were exposed to N-acetylcysteine (NAC) (E,G) and both NAC and APAP at the same time (F,H). (I) indicates averages of areas of the liver in 96 hpf larvae that were exposed to 2.5 mM APAP (2.5 APAP) and/or 20 µM NAC (n = 9 or 10). (J) indicates averages of areas of the liver in 96 hpf larvae that were exposed to 1 mM APAP (1 APAP) (n = 10). Scale bars: 200 µm. Bars with different letters in (I,J) (a, b) are significantly different (p < 0.05).