
|
Figure 1
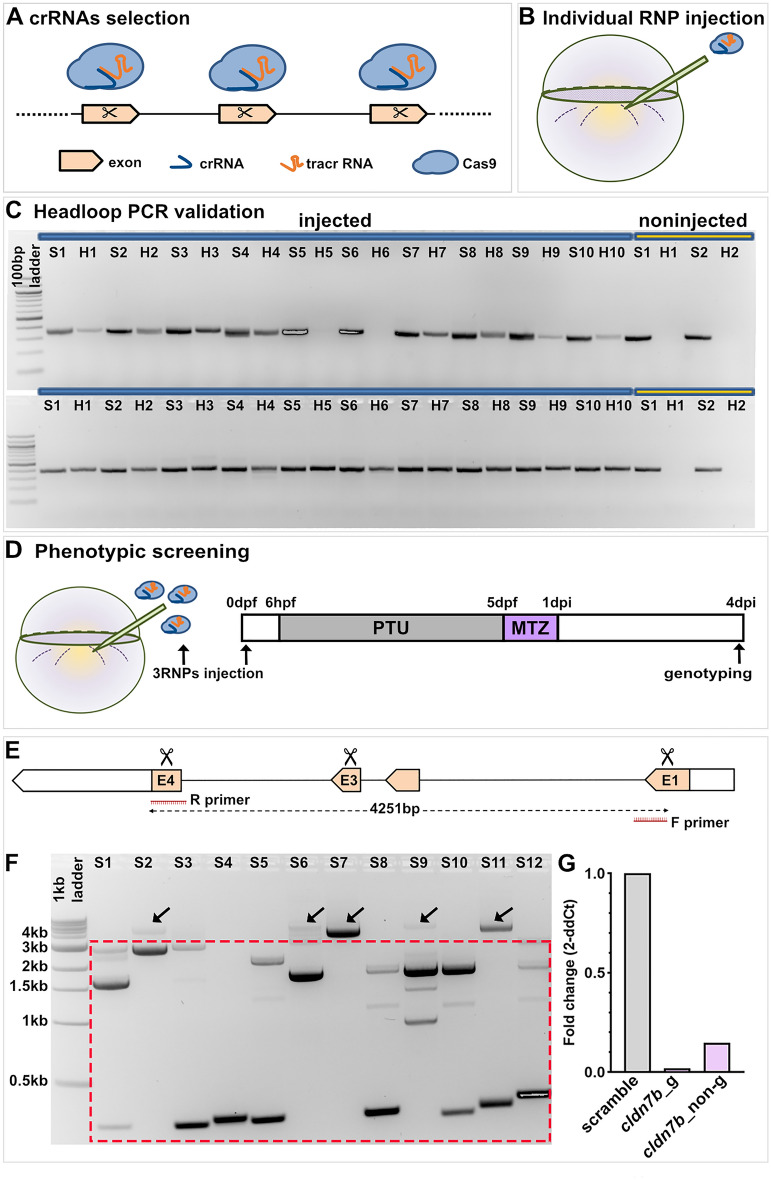
F0 screening pipeline to identify genes regulating RPE regeneration. (A) Design and selection of crRNAs. (B) Injection of individual RNP complexes (gRNAs (crRNA:tracrRNA) with Cas9 protein) into rpe65a:nfsB-eGFP embryos. (C) Example electrophoresis results of headloop PCR (H) targeting zgc:153911 (top gel) and nrg1 (bottom gel) in parallel with standard PCR (S) from ten RNP-injected embryos and two uninjected controls. Mutagenic rate = H+/S+ number of embryos. Mutagenic rate for zgc:153911: 80%; for nrg1: 100%. (D) Schematic of the injection/ablation and screening paradigm. (E) Schematic of cldn7b showing exon 1 (E1), 3 (E3), and 4 (E4) target loci (scissors) and PCR strategy to confirm intragenic deletions. (F) Example cldn7b data from individual RNP-injected larvae confirming intragenic deletions generated by simultaneously targeting three genomic sites. Gel bands within the dashed box indicate intragenic deletions. ~ 4 kb bands (arrows) represent either wild-type or mutated alleles with small indels. (G) Bar graph showing relative expression fold change of cldn7b from genotyped (cldn7b_g) and non-genotyped (cldn7b_non-g) F0 knockout larvae and scrambled controls. Each bar represents biological variation from n = 50 pooled larvae and technical variation from three replicates. Example gels shown in (C) and (F) have been color inverted and cropped for clarity and data presentation purposes. Original gel images are shown in Fig. S9. Abbreviations as follows: RNP, ribonucleoprotein; PTU, n-phenylthiourea; MTZ, metronidazole; hpf/dpf, hour/day (s) post-fertilization; dpi, day (s) post-injury.