
Image
|
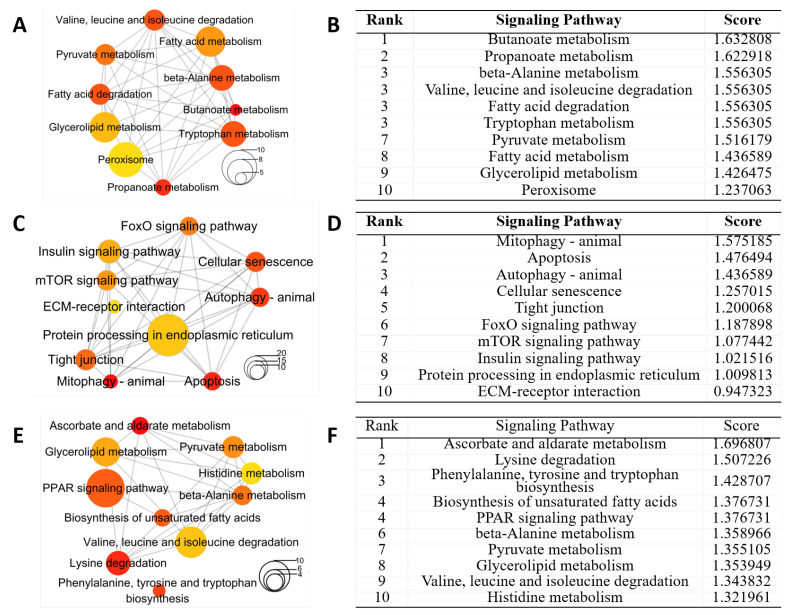
Figure Caption
Figure 6
Hub signaling pathways from KEGG enrichment analysis of DEGs in livers for different groups. Networks of top 10 hub pathways (A) and top 10 hub pathways ranked by DMNC method (B) for DEGs in group (a). Networks of top 10 hub pathways (C) and top 10 hub pathways ranked by DMNC method (D) for DEGs in group (b). Networks of top10 hub pathways (E) and top 10 hub pathways ranked by DMNC method (F) for DEGs in group (c). Node color and size stand for the enrichment p-value and the number of genes in the pathway, respectively.
Acknowledgments
This image is the copyrighted work of the attributed author or publisher, and
ZFIN has permission only to display this image to its users.
Additional permissions should be obtained from the applicable author or publisher of the image.
Full text @ Int. J. Mol. Sci.