
IMAGE
Figure 4 - figure supplement 1
- ID
- ZDB-IMAGE-230123-22
- Source
- Figures for Sabharwal et al., 2022
Image
|
Figure Caption
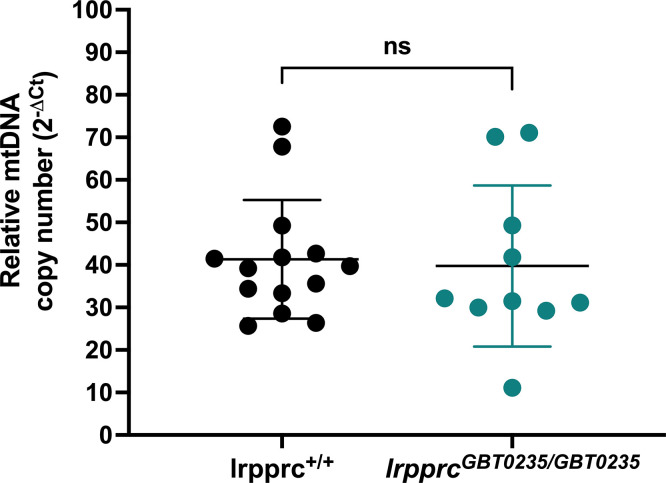
Figure 4 - figure supplement 1 Relative mtDNA copy number in lrpprc homozygous mutants: No significant change was observed in the homozygous mutants as compared to wild-type siblings (lrpprc+/+ vs lrpprcGBT0235/GBT0235; p-value = 0.8263).
Each data point represents a genotyped individual animal. mt-nd1 and polg were used as mitochondrial and nuclear control respectively. p-Value was estimated by the unpaired t-test. Error bars represent the standard deviation (Figure 4—source data 1).
Acknowledgments
This image is the copyrighted work of the attributed author or publisher, and
ZFIN has permission only to display this image to its users.
Additional permissions should be obtained from the applicable author or publisher of the image.
Full text @ Elife