
|
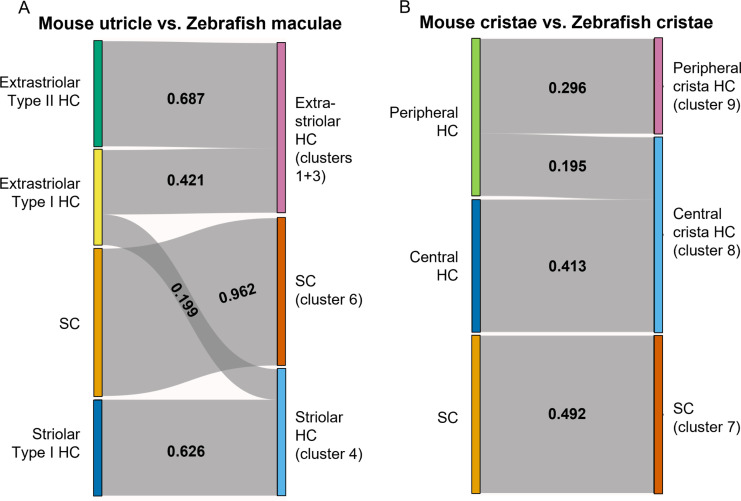
Figure 9
(A–B) Sankey plot showing the SAMap mapping scores (0–1) that indicate transcriptome relatedness between (A) mouse utricular and zebrafish macular single-cell clusters and (B) mouse and zebrafish cristae single-cell clusters. A mapping score of 0 indicates no evolutionary correlation in transcriptome while a mapping score of 1 indicates perfect correlation. Correlations below 0.15 were not plotted.
SAMap analysis reveals conserved gene expression patterns between mouse and zebrafish hair cell types.