
|
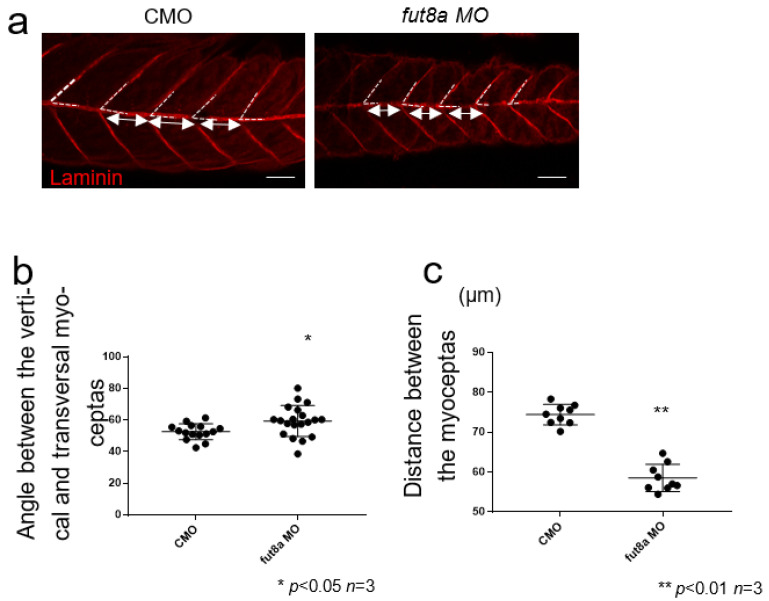
Figure 3 fut8a reduction causes structural abnormalities in myosepta (a) Left panel is CMO, right panel is fut8a MO. The white dotted line indicates the angle between the dorsal vertical and transverse myoseptas, and the double arrow indicates the distance of the transverse myoseptas, stained with anti-laminin. Scale bar: 50 μm. (b) Histogram of the angle between the vertical and transverse myoseptas. (c) Histogram of the variation in sarcomere length. Five to ten sarcomere lengths were calculated from five fish. CMO: Median 1.956, Max 2.032, Min 1.869. fut8a MO: Median 2.0325, Max 2.153, Min 1.772 (t-test. p < 0.01, n = 5).