
|
Fig. 10
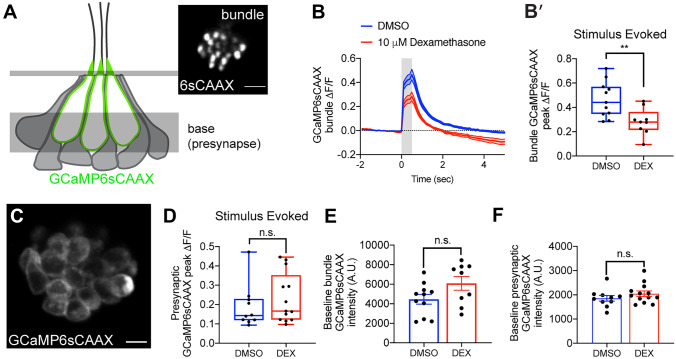
Dexamethasone exposure decreased evoked mechanosensation but not presynaptic calcium responses. A Schematic of a neuromast viewed from the side, and the imaging planes used to measure evoked calcium activity at the hair bundles and at the presynaptic region. Localization of GCaMP6sCAAX is shown in green. Inset shows an example of a top-down view of the hair bundle plane showing GCaMP6sCAAX fluorescence. B, B′ Evoked hair bundle calcium signal with (red) or without (blue) 48 h dexamethasone pretreatment. Average traces are shown in B, while dot plots of peak response of bundles per neuromast are shown in B′. C Top-down view of the basal plane showing the presynaptic membrane labeled with GCaMP6sCAAX. D Dot plots show that the peak evoked presynaptic calcium signal averaged per neuromast with (red) and without (blue) 48 h dexamethasone pretreatment. E, F Baseline calcium intensity with (red) and without (blue) dexamethasone treatment in hair bundles (E) and presynapses (F). Shaded area above and below traces in panel B and error bars in E and F represent SEM. Box-and-whiskers plot were used in B′ and D to show median, min and max. An unpaired Welch’s unequal variance t-test was used to calculate the significance of differences in B′ and D. An unpaired t-test was used to calculate the significance of differences in E and F. n ≥ 9 neuromasts per treatment. **P < 0.01. Scale bar = 5 µm in A inset and C