
Image
|
Figure Caption
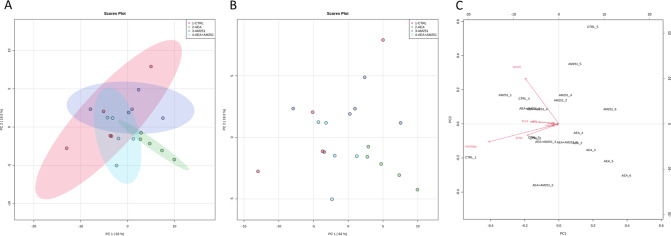
Fig. 6 Score plot of Ctrl (red), AEA (green), AM251 (blue), and AEA + AM251 (light blue) A with 95% confidence region or B without 95% confidence region. Axes show scores on PC1 (63%) and PC2 (19.3%). C Biplot shows the loading analysis with a red arrow representing the variables. The bottom and left axes show scores on PC1 and PC2, top and right axes show loading values.
Acknowledgments
This image is the copyrighted work of the attributed author or publisher, and
ZFIN has permission only to display this image to its users.
Additional permissions should be obtained from the applicable author or publisher of the image.
Full text @ Cell Death Dis.