
Image
|
Figure Caption
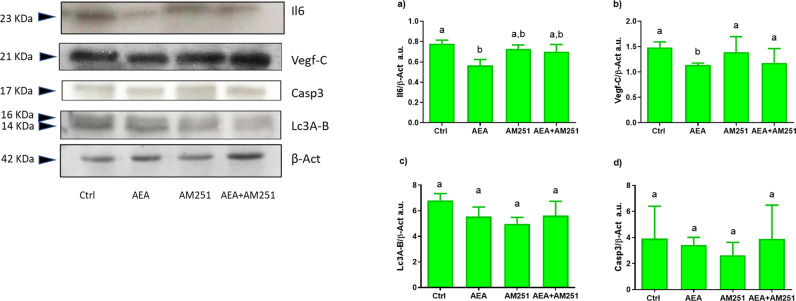
Fig. 5 Insets show a representative Il6, Vegf-C, Casp3, Lc3A/B, and β-Act Western Blot in the different experimental groups. Densitometric analysis of three independent experiments, a.u. (arbitrary units) a Il6, b Vegf-C, c Lc3A/B, d Casp3. Different letters above each column indicate statistical differences among groups (one-way ANOVA, P < 0.05).
Acknowledgments
This image is the copyrighted work of the attributed author or publisher, and
ZFIN has permission only to display this image to its users.
Additional permissions should be obtained from the applicable author or publisher of the image.
Full text @ Cell Death Dis.