
|
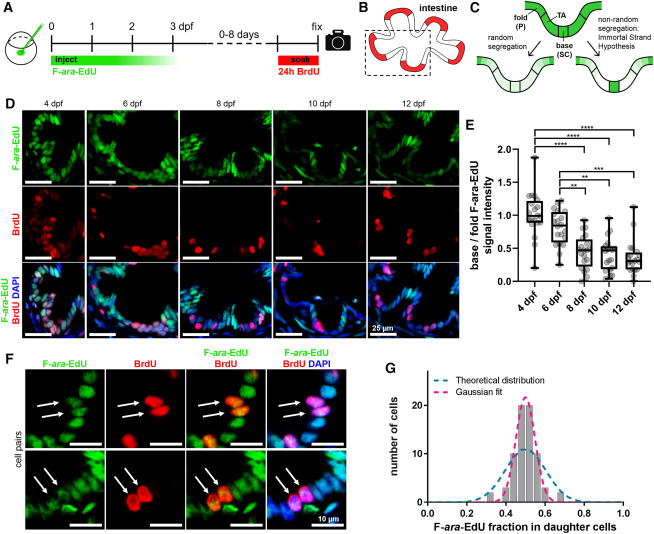
Fig. 3 Figure 3. Template strand segregation in the intestine (A) Zygotes were injected with 5.7 pmol F-ara-EdU; 10 mM BrdU was administered through incubation for 24 h before the end of the variable chase period. (B) Scheme of the intestine highlighting the proliferative zone at the base of intestinal folds in red. (C) Models of F-ara-EdU pulse dilution in two hypothetical scenarios: random template strand segregation and nonrandom template strand segregation according to the immortal strand hypothesis. (D) Observed F-ara-EdU label depletion and colocalization with BrdU. (E) Quantification of F-ara EdU signal decay in base vs. fold cells (see STAR Methods). Statistical significance was determined using the Kruskal-Wallis test with post hoc multiple comparisons. n = 100 base/fold structures, 19 fish total (20 base/fold structures and 3–4 fish per time point). Box and whiskers plot represents median (line in box center), first and third quartile (lower and upper box border, respectively), and minimum and maximum values (whiskers), as well as individual data points (spheres). (F) Examples of F-ara-EdU/BrdU double-positive cell pairs (arrows). (G) F-ara-EdU intensity ratios in daughter cells (n = 35 pairs, see STAR Methods). A binomial curve centered at 0.5 (magenta) was fitted to the data (R2 = 0.99). The blue curve represents the theoretical, normal (Gaussian) distribution for random segregation. Quantification was performed using raw images (see STAR Methods), whereas images shown in in (D) and (F) were adjusted in brightness and contrast for better visualization. P, postmitotic cells; SC, stem cells; TA, transit-amplifying cells. ∗∗p ≤ 0.01, ∗∗∗p ≤ 0.001, ∗∗∗∗p ≤ 0.0001.