
Figure 4
- ID
- ZDB-IMAGE-221214-91
- Publication
- Wang et al., 2022 - Methyltransferase SMYD3 impairs hypoxia tolerance by augmenting hypoxia signaling independent of its enzymatic activity
- All Figures
- Figures for Wang et al., 2022
|
Figure 4
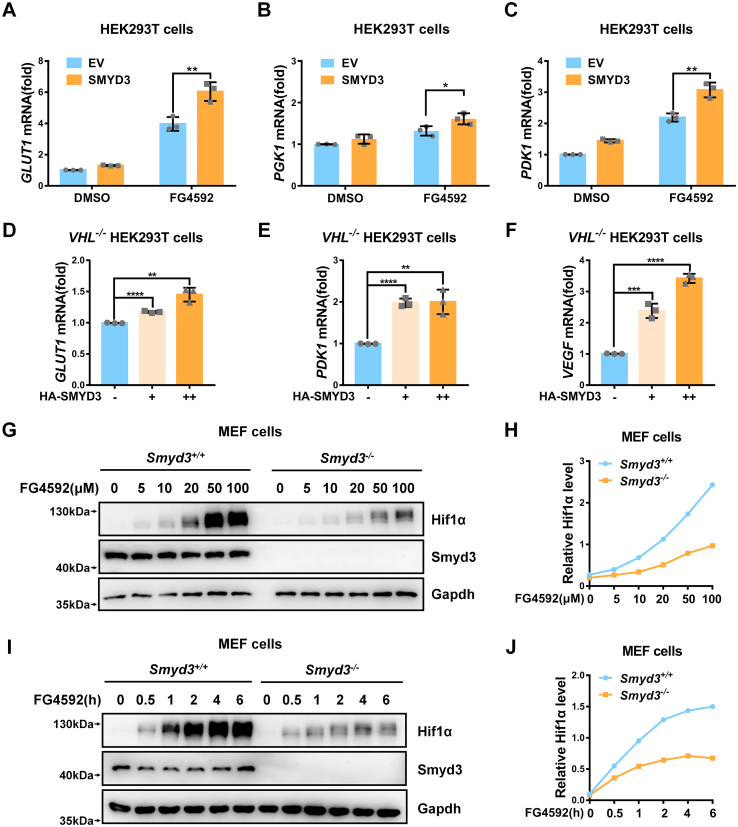
The induction of HIF1α target genes expression and stabilization of HIF1α by SMYD3 are independent of HIF1α hydroxylation and pVHL intactness. A–C, qPCR analysis of GLUT1 (A), PGK1 (B), and PDK1 (C) mRNA in HEK293T cells transfected with or without pCMV-SMYD3 for 24 h, followed by treatment with DMSO or FG4592 (100 μM) for 8 h. EV, pCMV empty vector (control). Data show mean ± SD; Student’s two-tailed t test. ∗p < 0.05, ∗∗p < 0.01. Data from three independent experiments. D–F, qPCR analysis of GLUT1 (D), PDK1 (E), and VEGF (F) mRNA in VHL-deficient HEK293T cells (VHL−/−) transfected with an increasing amount of pCMV-SMYD3 expression plasmid. pCMV empty vector was used as a control (-). Data show mean ± SD; Student’s two-tailed t test. ∗∗p < 0.01, ∗∗∗p < 0.001, ∗∗∗∗p < 0.0001. Data from three independent experiments. G, immunoblotting of endogenous Hif1α expression in Smyd3-deficient or wildtype MEF cells (Smyd3−/− or Smyd3+/+) treated with an increasing amount of FG4592 for 6 h. H, the relative intensities of Hif1α in (G) determined by normalizing the intensities of Hif1α to the intensities of Gapdh. I, immunoblotting of endogenous Hif1α expression in Smyd3-deficient or wildtype MEF cells (Smyd3−/− or Smyd3+/+) treated with an increasing time of FG4592 (100 μM) for 0 to 6 h. J, the relative intensities of Hif1α in (I) determined by normalizing the intensities of Hif1α to the intensities of Gapdh. HIF, hypoxia-inducible factor; MEF, mouse embryonic fibroblast; qPCR, quantitative RT–PCR; VHL, von Hippel-Lindau.