
|
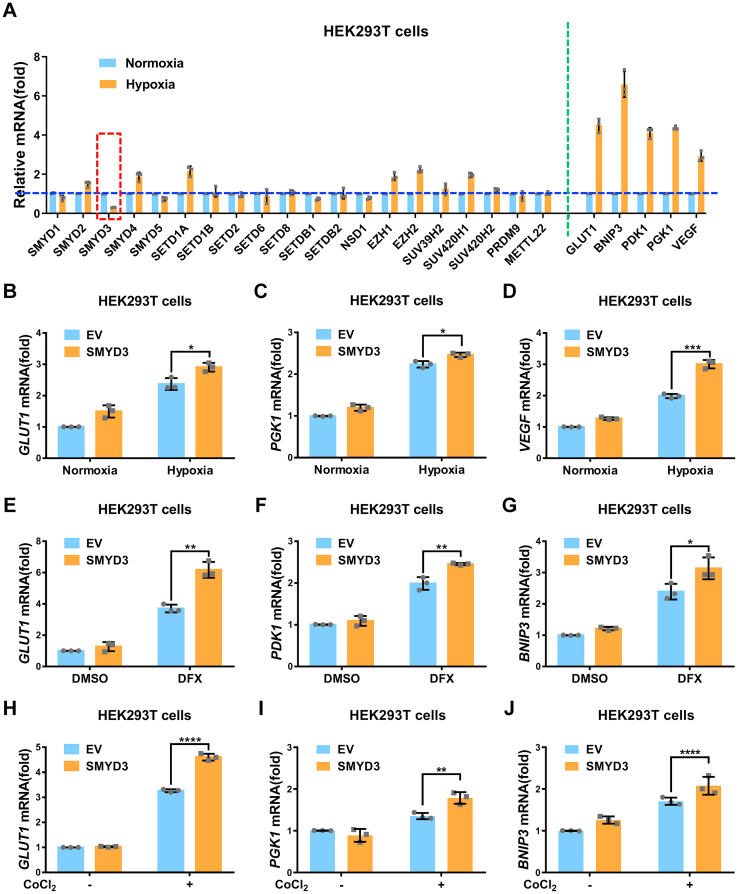
Figure 1
SMYD3 augments hypoxia signaling. A, quantitative real-time PCR (qPCR) analysis of mRNA levels of indicated lysine methyltransferase genes and hypoxia signaling target genes in HEK293T cells under normoxia (21% O2) or hypoxia (1% O2) for 24 h. B–D, qPCR analysis of GLUT1 (B), PGK1 (C), and VEGF (D) mRNA in HEK293T cells transfected with or without pCMV-SMYD3 under normoxia (21% O2) or hypoxia (1% O2) for 24 h. E–G, qPCR analysis of GLUT1 (E), PDK1 (F), and BNIP3 (G) mRNA in HEK293T cells transfected with or without pCMV-SMYD3 and treated with DFX (150 μM) or DMSO as a control for 8 h. H–J, qPCR analysis of GLUT1 (H), PGK1 (I), and BNIP3 (J) mRNA in HEK293T cells transfected with or without pCMV-SMYD3 and treated with or without CoCl2 (200 μM) for 8 h. EV, pCMV empty vector (control). Data show mean ± SD; Student’s two-tailed t test. ∗p < 0.05, ∗∗p < 0.01, ∗∗∗p < 0.001, ∗∗∗∗p < 0.0001. Data from three independent experiments.