IMAGE

Figure 3

ID
ZDB-IMAGE-221214-216
Source
Figures for Lee et al., 2022
Image
Figure Caption

Figure 3

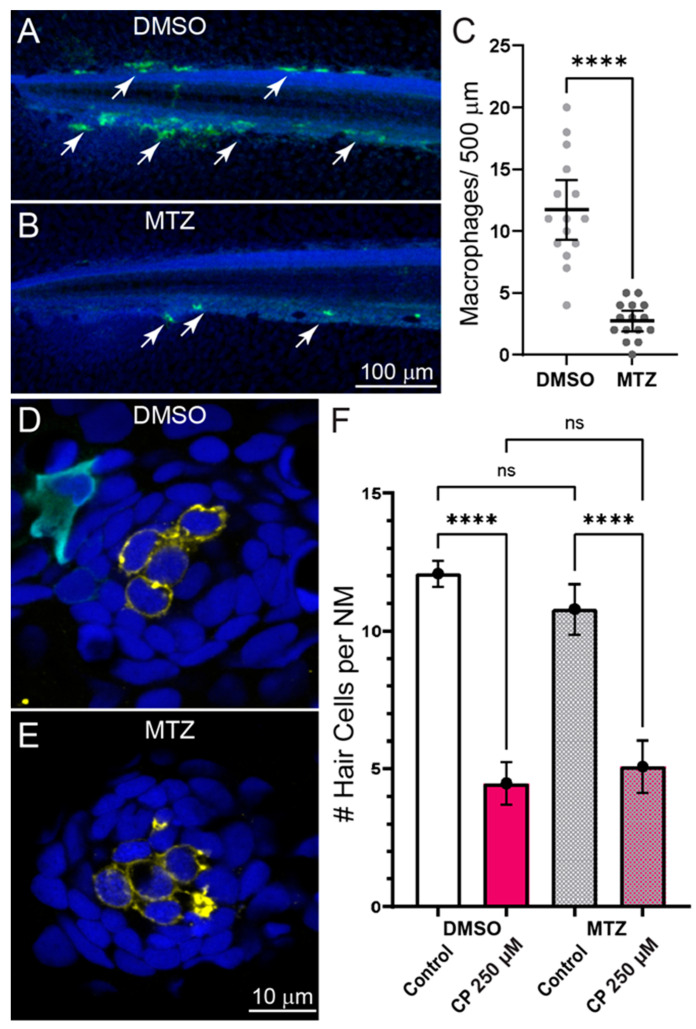
Depleting macrophages does not affect cisplatin induced neuromast hair cell loss. (AC) Selective depletion of macrophages in double transgenic fish (gl25Tg, Tg(mpeg1.1:GAL4FF); c264Tg, Tg(UAS-E1B:NTR-mCherry). (A,B) Representative images of macrophage distribution (indicated with arrows) within the posterior-most 500 µm of the spinal column of fish treated with for 24 h with 0.1% DMSO (A) or 10 mM MTZ (B). (C) MTZ-treated fish showed a significant depletion of macrophages relative to DMSO-treated control (Unpaired t-test; **** p < 0.0001). Bars = Mean w/95% CI. Data obtained from 16 fish/treatment group. (D,E) Single z-section images taken from confocal stacks of neuromasts in fish following treatment with 250 µM cisplatin. Macrophages are labeled with YFP (cyan), hair cells with an antibody to Otoferlin (HCS-1; yellow) and all cell nuclei are labeled with DAPI (blue). (F) Quantification of hair cell loss following exposure to 250 µM cisplatin and 24 h recovery. Significant hair cell loss following cisplatin was observed in both DMSO and MTZ treatment groups relative to controls (Tukey’s multiple comparisons test, **** adjusted p < 0.0001), but no difference in cisplatin-induced hair cell loss was observed between DMSO and MTX treatment groups (adjusted p = 0.6415) Bars = Mean w/95% CI. n = 37–39 fish per treatment group, N = 3 trials.

Figure Data
Acknowledgments
This image is the copyrighted work of the attributed author or publisher, and ZFIN has permission only to display this image to its users. Additional permissions should be obtained from the applicable author or publisher of the image. Full text @ Int. J. Mol. Sci.