
Image
|
Figure Caption
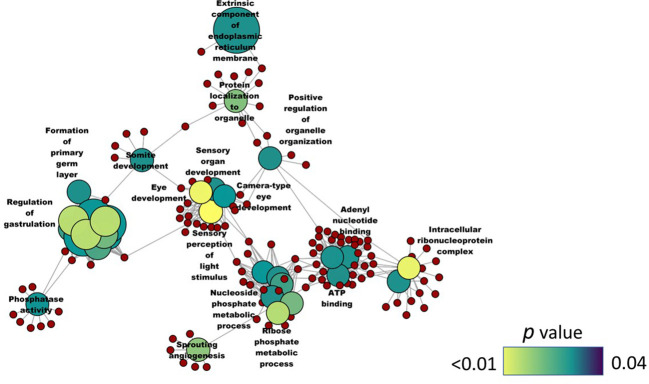
Figure 6
Network plot showing the link between the enriched GO terms. DEGs (downregulated; SBM vs CT) that were considered for the enrichment are indicated using red circles and only the non-redundant GO terms are shown in the cluster. The gradient color bar intensity varies with the
Acknowledgments
This image is the copyrighted work of the attributed author or publisher, and
ZFIN has permission only to display this image to its users.
Additional permissions should be obtained from the applicable author or publisher of the image.
Full text @ Front Immunol