
Image
|
Figure Caption
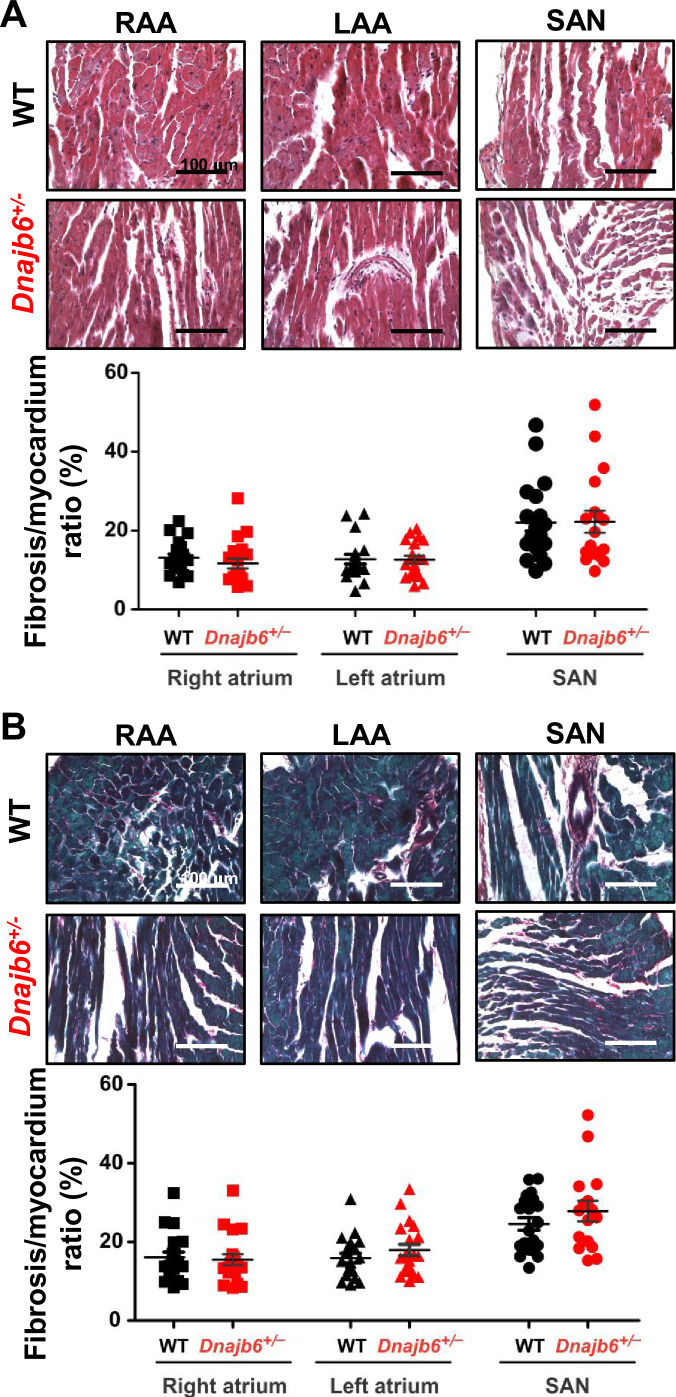
Figure 5—figure supplement 2. Fibrotic tissue content in atrial and SAN myocardium of Dnajb6+/-vs.WT mice.
(A–B) Masson’s Trichrome (A) and Picrosirius Red (B) staining of WT and Dnajb6+/- mice are shown for left (LAA) and right (RAA) atrial appendages as well as SAN regions. Below the representative images, summarized data for fibrotic to myocardial tissue ratio are shown for each staining. N=4 mice per group. Scale bars, 100 µm.
Acknowledgments
This image is the copyrighted work of the attributed author or publisher, and
ZFIN has permission only to display this image to its users.
Additional permissions should be obtained from the applicable author or publisher of the image.
Full text @ Elife