
|
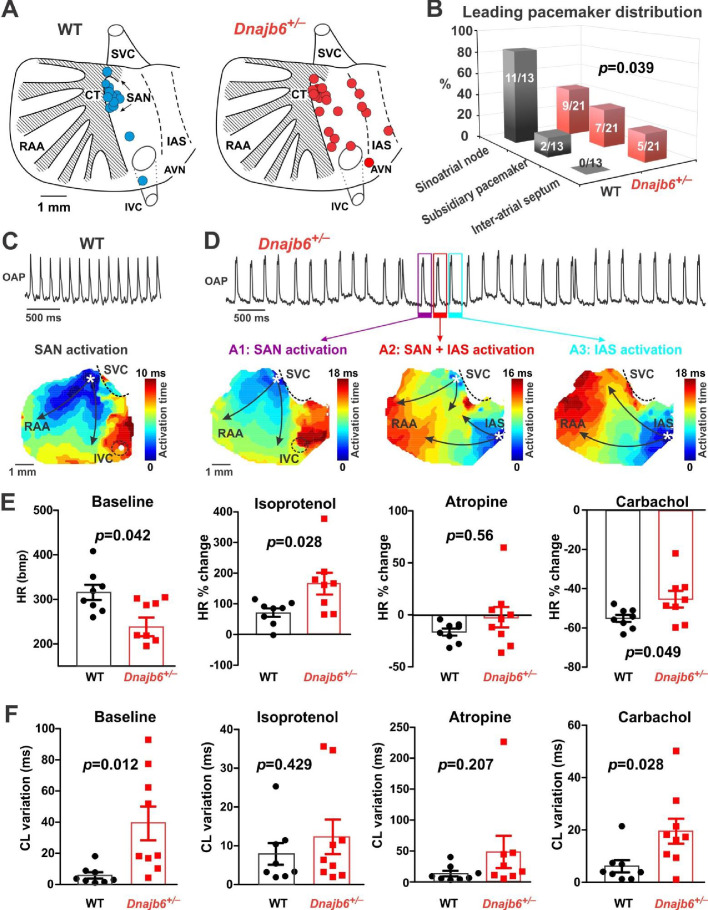
Figure 5 SAN dysfunction in the Dnajb6+/- mice.
(A) Leading pacemakers were located and plotted from both WT (blue dots) and Dnajb6+/- (red dots) mice. One mouse could have multiple leading pacemaker locations due to the competing pacemakers and ectopic activities. SVC and IVC, superior and inferior vena cava; RAA, right atrial appendage; CT, crista terminalis; IAS, inter-atrial septum; AVN, atrioventricular node. Distribution of the leading pacemakers is summarized in panel. (B) Majority of leading pacemakers located within the SAN area in WT, whereas, in Dnajb6+/- mice, significant increase of leading pacemakers locating in subsidiary pacemaker area and IAS was observed. p-value by Fisher exact test. (C–D) Activation map based on the optical mapping of action potentials showed representative leading pacemaker locations in WT (SAN) and Dnajb6+/- mice (SAN and IAS areas). (E) Optical mapping on isolated atrial preparation showed bradycardia (baseline) and different responses of heart rate during isoproterenol, atropine, and carbachol stimulations between WT and Dnajb6+/- mice. N=7–9 mice per group. Unpaired student’s t-test. (F) Increased cycle length (CL) variation was observed in Dnajb6+/- isolated atrial preparations during different autonomic stimulations. N = 7–9 mice per group, unpaired student’s t-test.