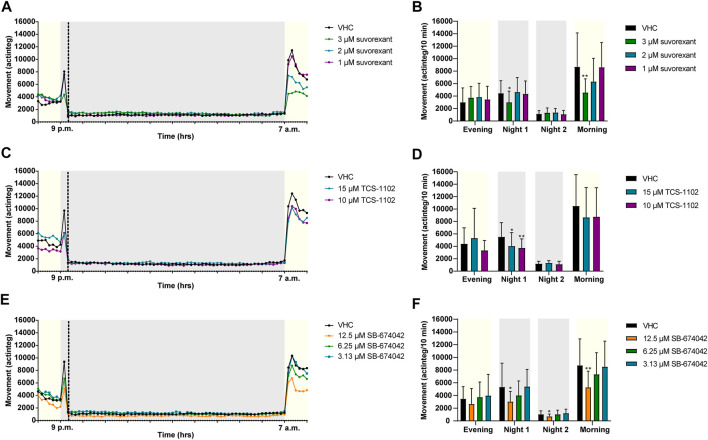
IMAGE

FIGURE 4

ID
ZDB-IMAGE-221109-7
Source
Figures for Pardon et al., 2022
Image
Figure Caption

FIGURE 4

Behavioral analysis of 6 dpf zebrafish larvae treated with orexin receptor antagonists in the night assay. Locomotor profiles of animals are expressed as mean actinteg units per 10 min treated with suvorexant (A), TCS-1102 (C) and SB-674042 (E) are plotted as function of time. Different phases are shown, i.e. the light phase from 8 p.m. to 9 p.m. (i.e., Evening), the first dark phase from 9 p.m. to 9:20 p.m. (i.e., Dark 1), the second dark phase from 9:20 p.m. to 7 a.m. (i.e., Dark 2), and the light phase from 7 a.m. to 8 a.m. (i.e., Morning). For the sake of clarity, standard deviations are not shown. Total locomotor activity was averaged (±SD) per respective light or dark phase (B–F) For each compound, data were pooled from three independent experiments with 9–10 replicate wells per test condition (n = 27–30, except for 15 µM TCS-1102 (n = 20)). Statistical analysis: two-way ANOVA with Dunnett’s multiple comparison test. Significance levels: *p ≤ 0.05, **p ≤ 0.01.

Acknowledgments
This image is the copyrighted work of the attributed author or publisher, and ZFIN has permission only to display this image to its users. Additional permissions should be obtained from the applicable author or publisher of the image. Full text @ Front Pharmacol